Every monthly report I have ever written had a column of percentages in it. Sixty per cent here, forty there, a hundred on the bits that are finished. Everyone reads it, nobody argues with it, and it answers almost nothing.
Because the two questions people actually came to the meeting with are what date will we finish, and what will it cost by the end. A percentage answers neither. It does not say whether sixty per cent is on time, what it does to the completion date, or what has been spent getting there.
So the report goes out, the date on the contract stays where it is, and it does not move until it is far too late to move it usefully.
One card per activity that should have started
Recording progress has to be quick or it does not happen. Pick the day you are reporting and the tool lists only the activities that were due to have started by then — so on a nine-thousand-line programme you are looking at nine rows, not scrolling for the ones that matter.
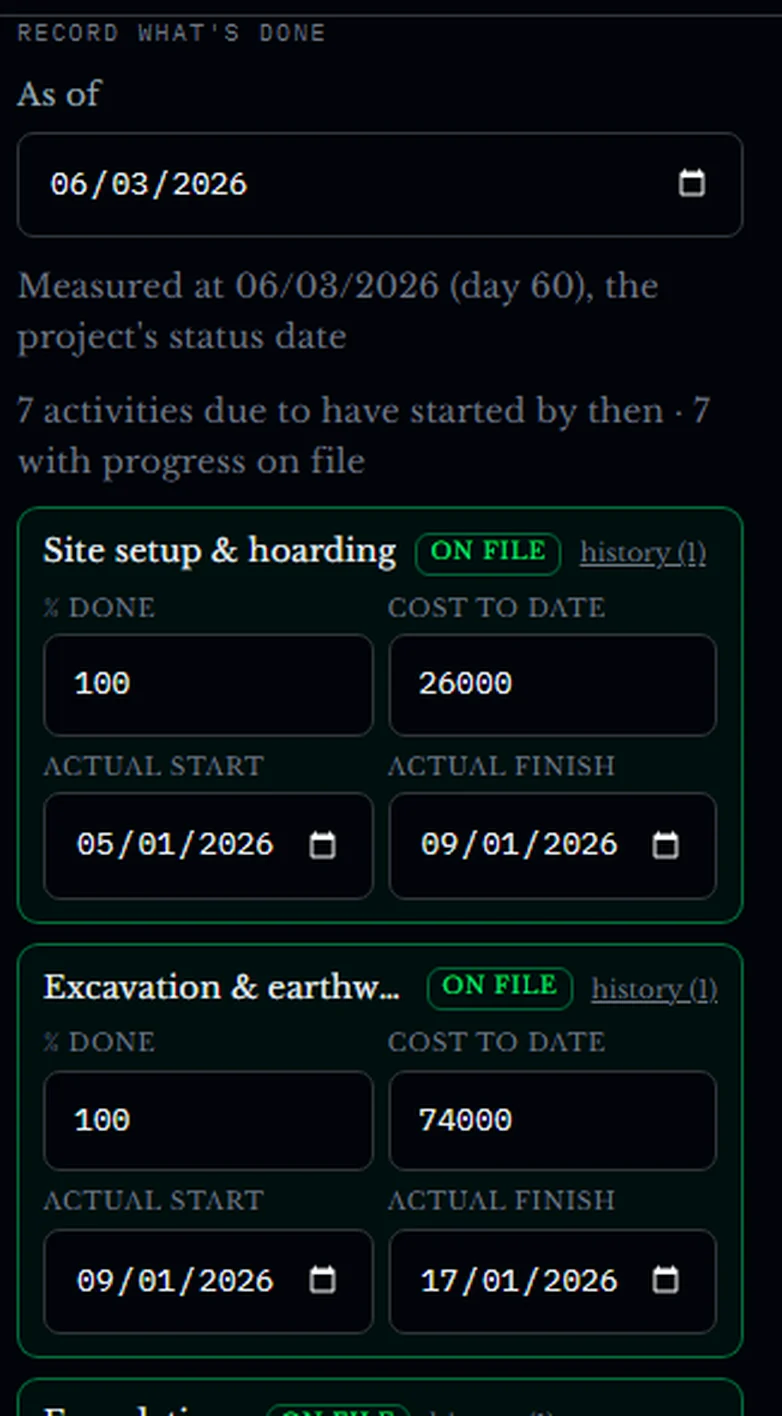
Four fields, and three of them are the ones that make the arithmetic work. Cost to date is what turns a progress update into a cost report. Actual start and finish are what let the forecast move. A percentage on its own can only ever be a percentage.
Nothing is overwritten
This is the part I would defend hardest. Every observation stays on file with the date it was reported against. Nothing is replaced, and nothing quietly disappears when somebody updates a figure.
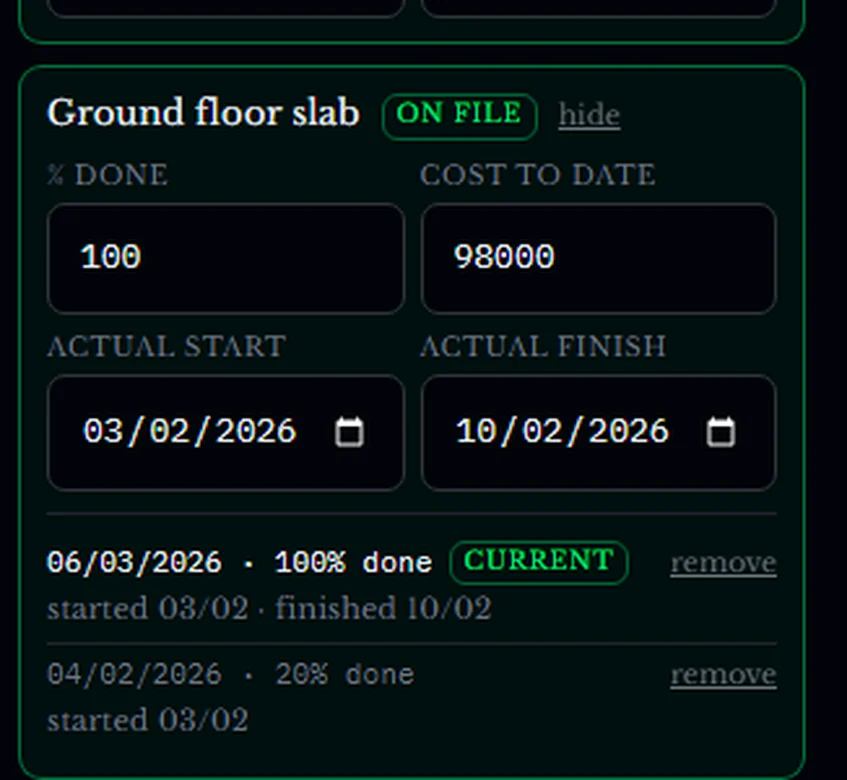
Typed the wrong figure? Remove that entry and the one before it takes over, with the forecast and the money following it immediately. No hunting for what the old number was, and no version of the truth that only exists in somebody's inbox.
What that progress does to the job
The moment anything is recorded, the same screen tells you what it means — in days and in pounds, not as a status colour.
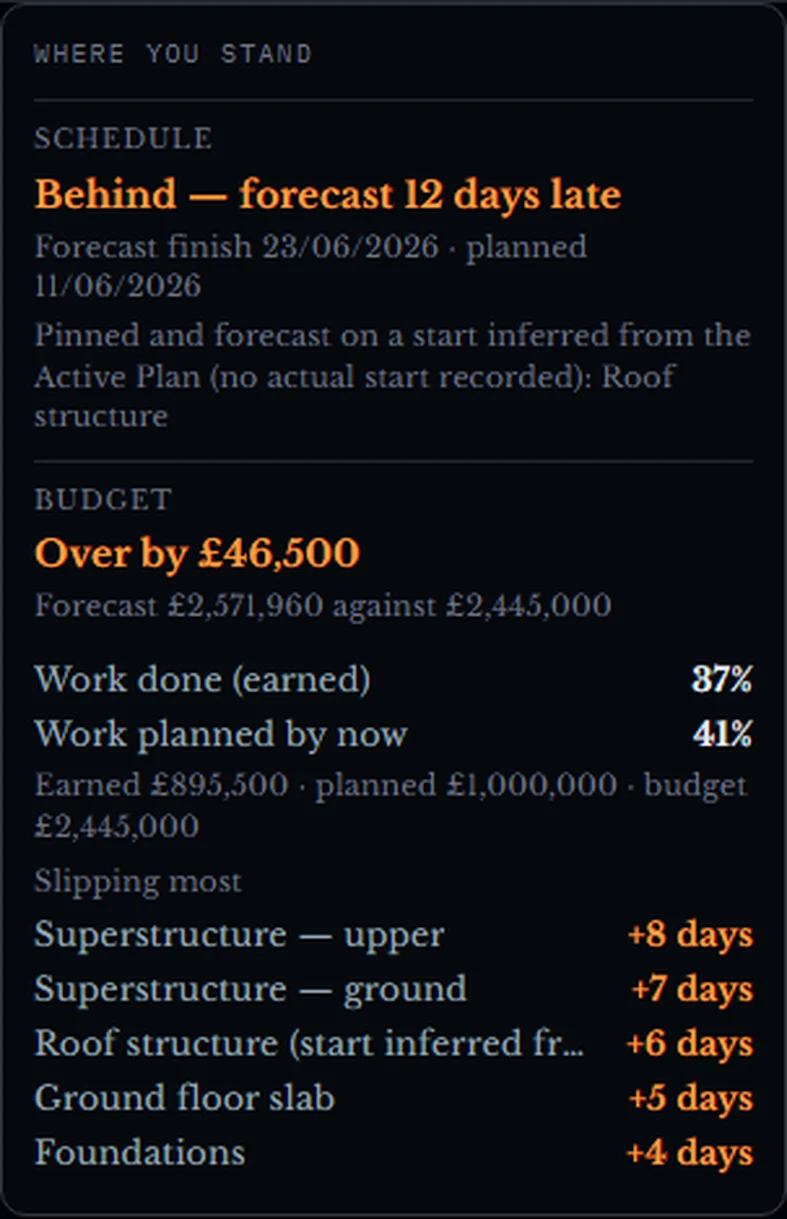
The slipping list is the bit that changes a meeting. "We are behind" invites an argument. "Superstructure upper is eight days, ground is seven, roof is six" invites a decision, because it names the work and the size of the problem in the same line.
And it is judged against the plan you chose to work to, not against whatever programme happened to be imported first. If you have optimised the schedule and adopted the result, that is the plan progress is measured against.
It tells you when it filled in a blank
Site data arrives incomplete. Somebody reports the roof structure half done and never types a start date. The tool has to assume one in order to forecast anything at all — so it assumes the plan's date, uses it, and then says so.

A tool that guesses silently is worse than one that refuses to guess. This one guesses out loud, in every place the guess affects a number, which means you can decide whether to chase the real date or accept the assumption.
"What did we know on the fourth of February?"
This is the question that comes up in every delay conversation, and it is normally unanswerable, because the spreadsheet has been overwritten twelve times since then.
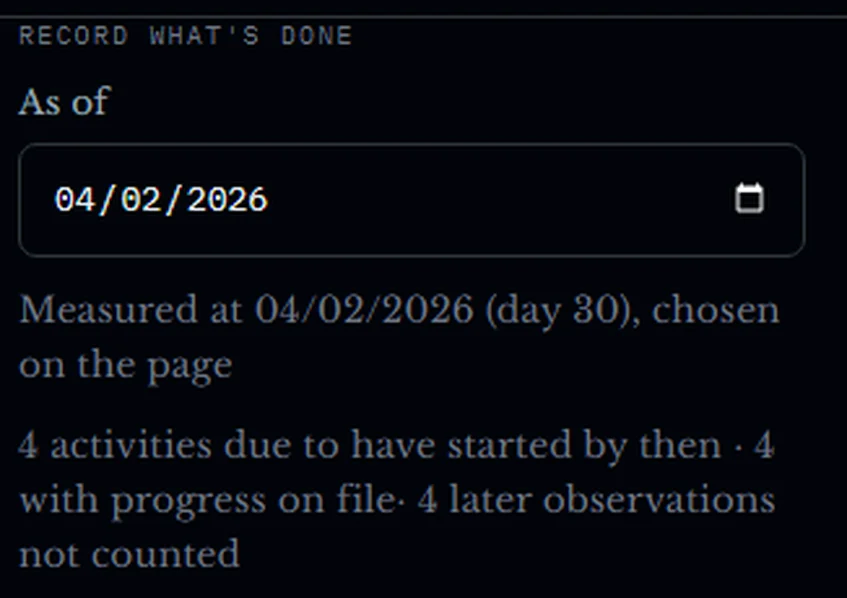
That last line matters more than it looks. A look-back with four observations excluded could easily read as missing data and get argued away. Saying so on the screen turns it into what it actually is: an honest view of what was known at the time.
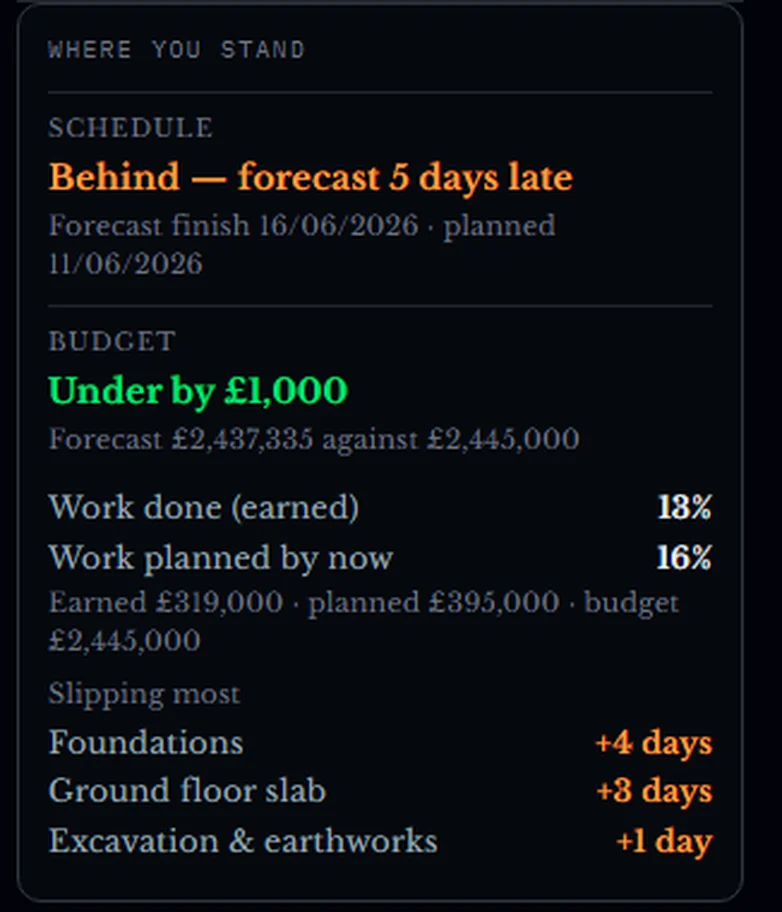
Two snapshots, and suddenly you have a direction of travel rather than a number to defend. Five days and a thousand pounds under is a good month. Twelve days and forty-six thousand over is a different job. The gap between them is a trend, and a trend is much harder to talk anybody out of.
Planned, earned and actual — at the same day
The money side reads from exactly the same data, taken at exactly the same measured-at day.
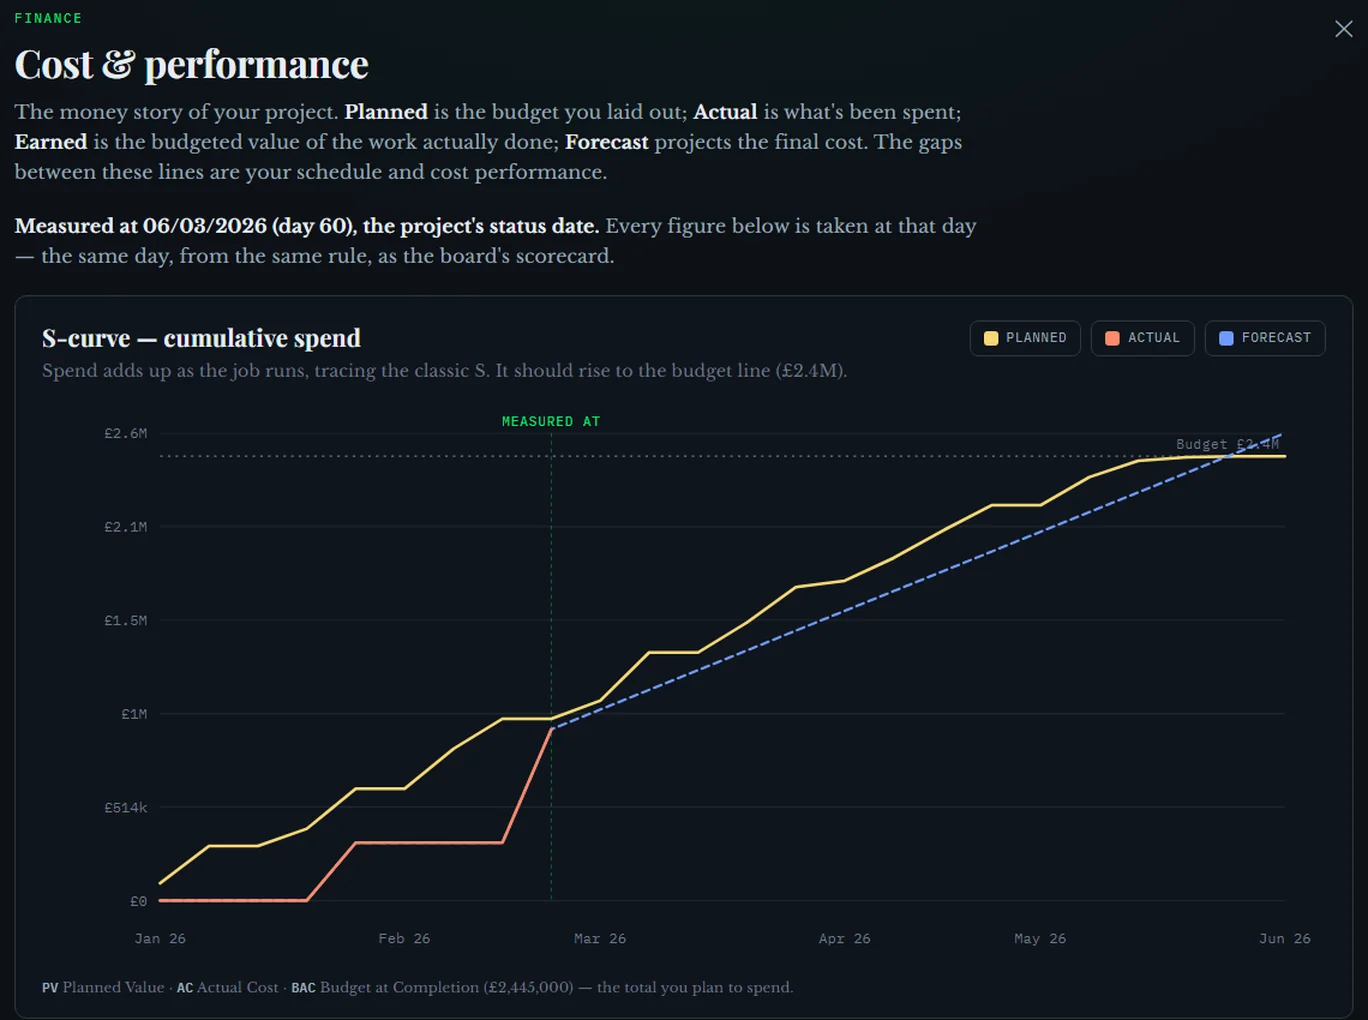
Which means the cost report and the progress panel cannot disagree. There is only one set of numbers underneath, and one stated day they were taken at. On most jobs that is the single biggest source of monthly argument, and it is a data problem rather than a judgement one.
The two efficiency indices come out of the same run, and they are written in pounds wherever they appear: schedule 0.90, which is £104,500 of planned work not yet earned, and cost 0.95, which is £46,500 more spent than earned. Nobody on site has to remember which index is which, or translate 0.90 into something they can act on.
The wider money view — the spend curve, the weekly cost of simply being on site, and the final account as a range — is covered properly in the money view of the whole job.
Why any of this is worth the effort
Because progress data is the only thing on a construction project that gets collected every single week and then used for almost nothing. It goes into a percentage column, the percentage column goes into a report, and the report gets filed.
Recorded properly, the same ten minutes of typing gives you a forecast finish, a forecast cost, a ranked list of what is dragging, a defensible view of any past date, and a cost report that agrees with the programme. None of that is extra work. It is the same work, kept.
Try it on your own programme
GeneraGantt reads MS Project, Primavera P6 and Asta Powerproject, and the progress and earned-value reports download as CSV and PDF, each stating the day they were measured at. Nothing is saved: your schedule leaves with you.
It is free while it is in testing, with a sample programme loaded, so you can record a few activities and watch the forecast move without uploading anything of your own.
Figures in this article come from the sample programmes in GeneraGantt.