On most jobs the programme and the money live in different buildings. The planner owns one, the QS owns the other, and they meet once a month to disagree about a figure that neither of them can fully derive.
That gap is where overruns hide. The programme knows the work has slipped but not what the slippage costs. The cost report knows the money has gone but not which activities took it. Put them on the same data and most of the argument disappears.
The S-curve, with a third line
Everyone has seen the spend curve. Planned money over time, rising to the budget at completion. On its own it tells you very little.
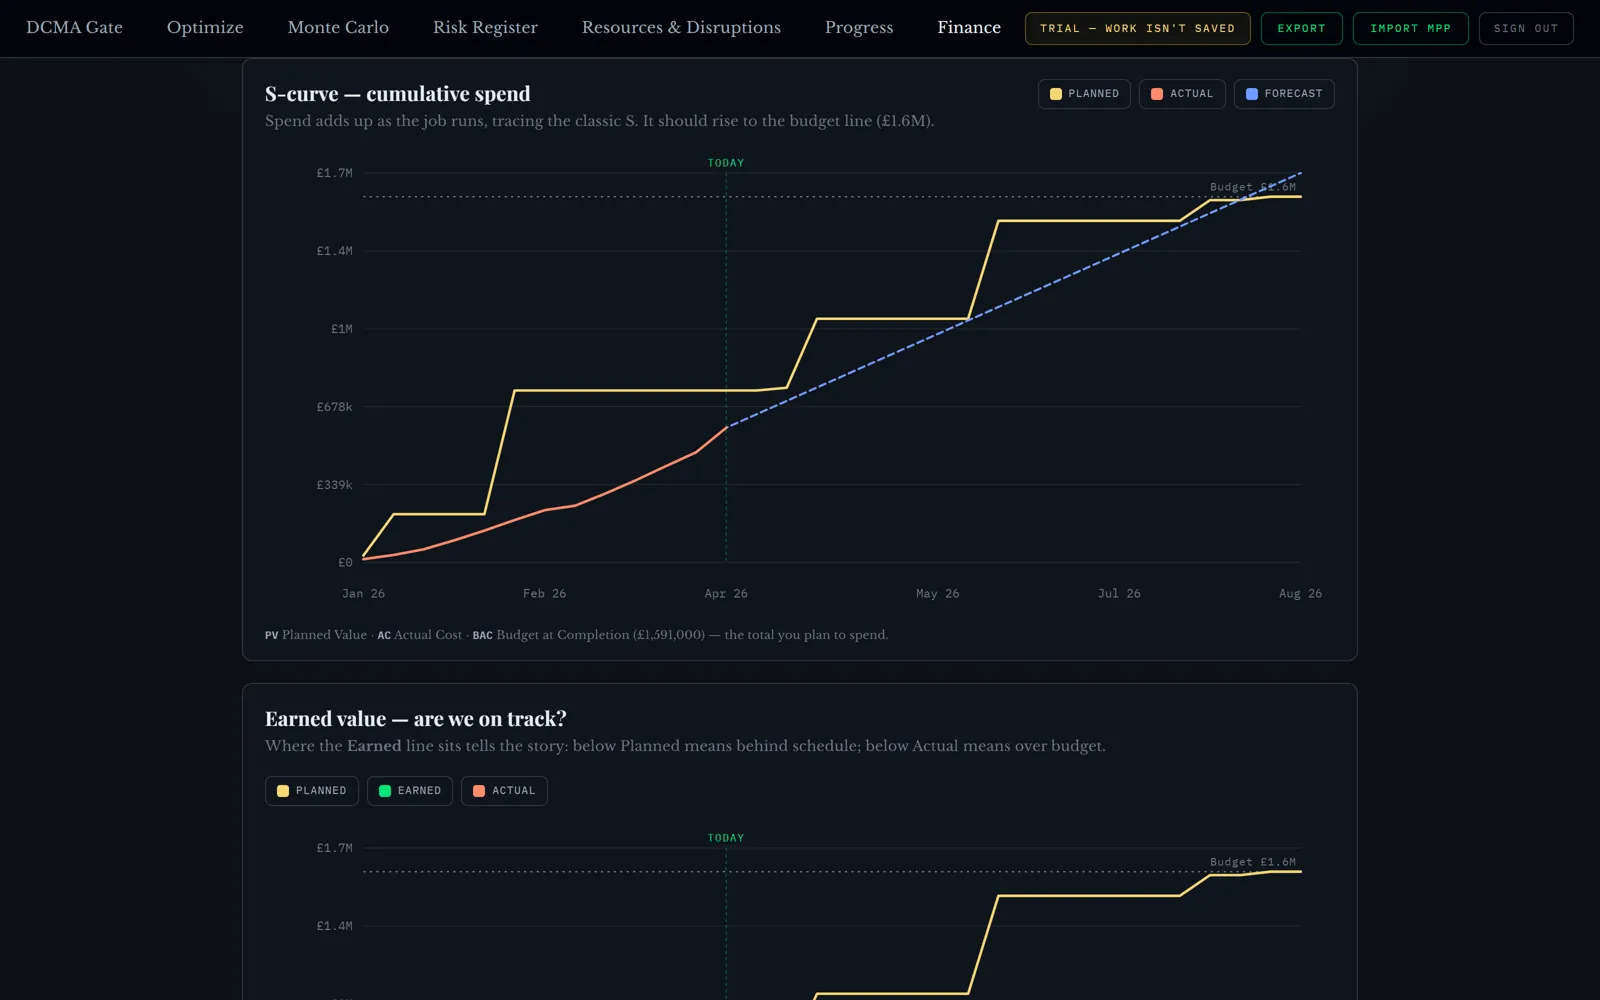
The third line is the one that matters: a forecast that continues from where you actually are, rather than assuming the rest of the job behaves exactly as planned. One glance tells you whether the money is tracking the plan or drifting away from it, and it does it before the drift is large enough to appear in a monthly report.
Are we actually on track?
This is the question a commercial manager asks, and percent complete cannot answer it. Earned value can: it compares the worth of the work done against what was planned by now, and against what has been spent getting there.
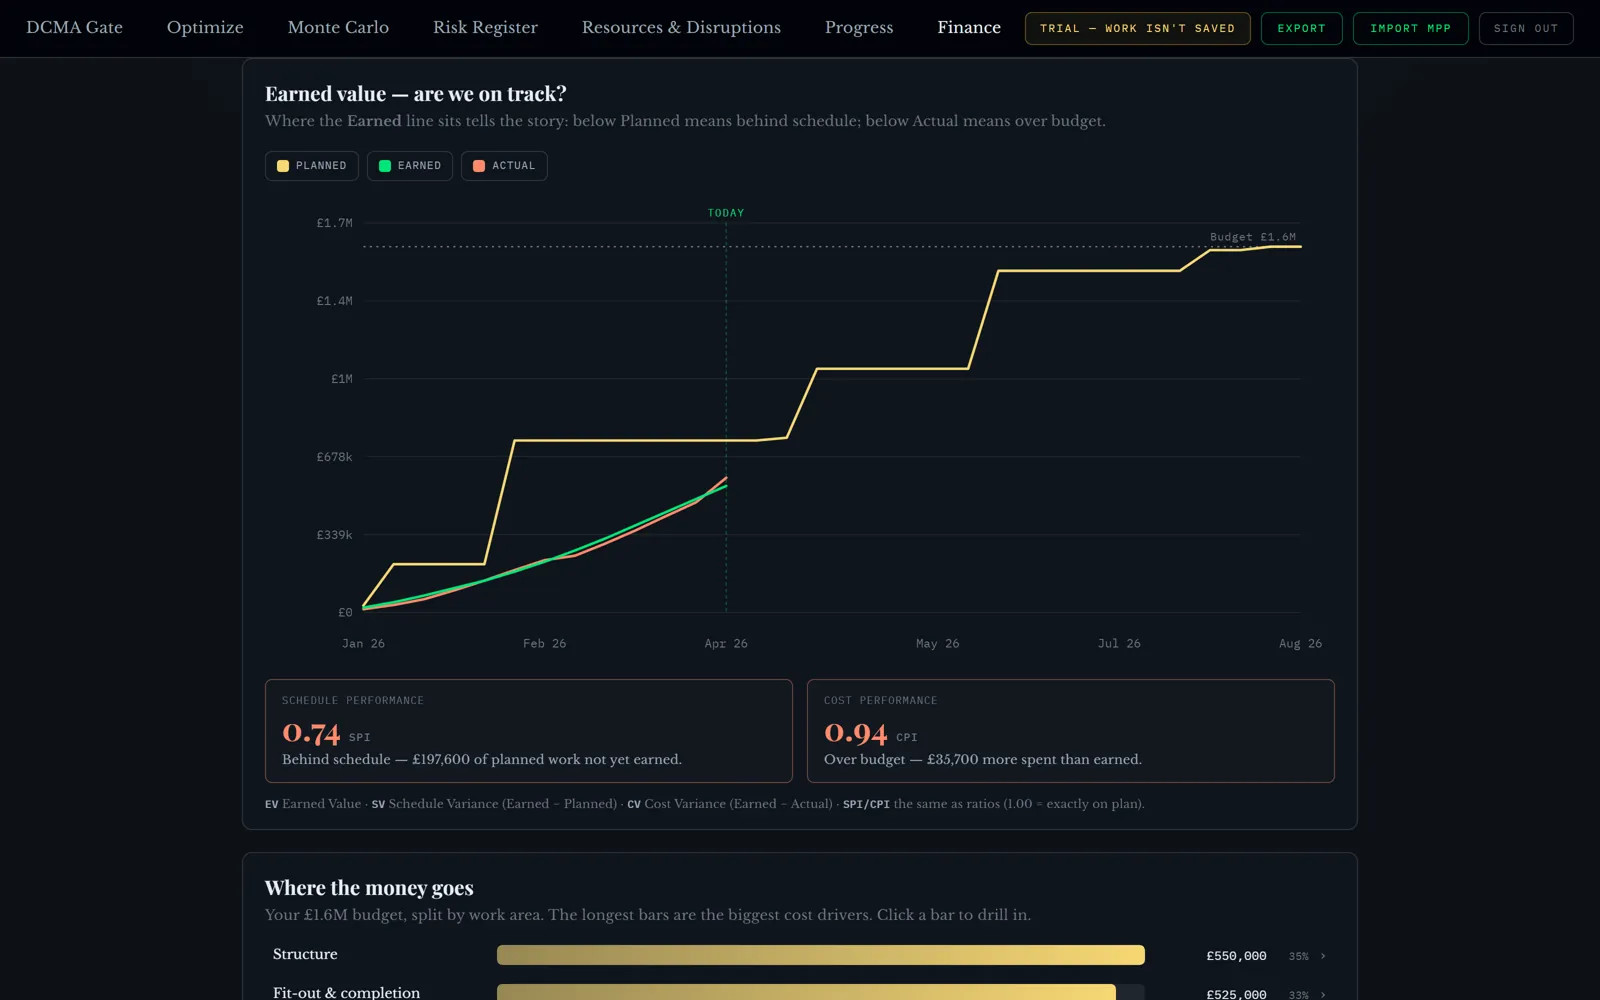
Both indices are written out in pounds underneath. Nobody in the meeting has to remember which one is cost and which one is schedule, and nobody has to translate 0.74 into something they can act on. I have watched that single choice change how a progress meeting goes.
The two numbers also mean different things, and lumping them together loses that. Behind schedule is work not yet done; it can sometimes be recovered by resequencing. Over budget is money already consumed; it generally cannot.
Getting better or getting worse?
A single snapshot is arguable. The direction of travel is not.
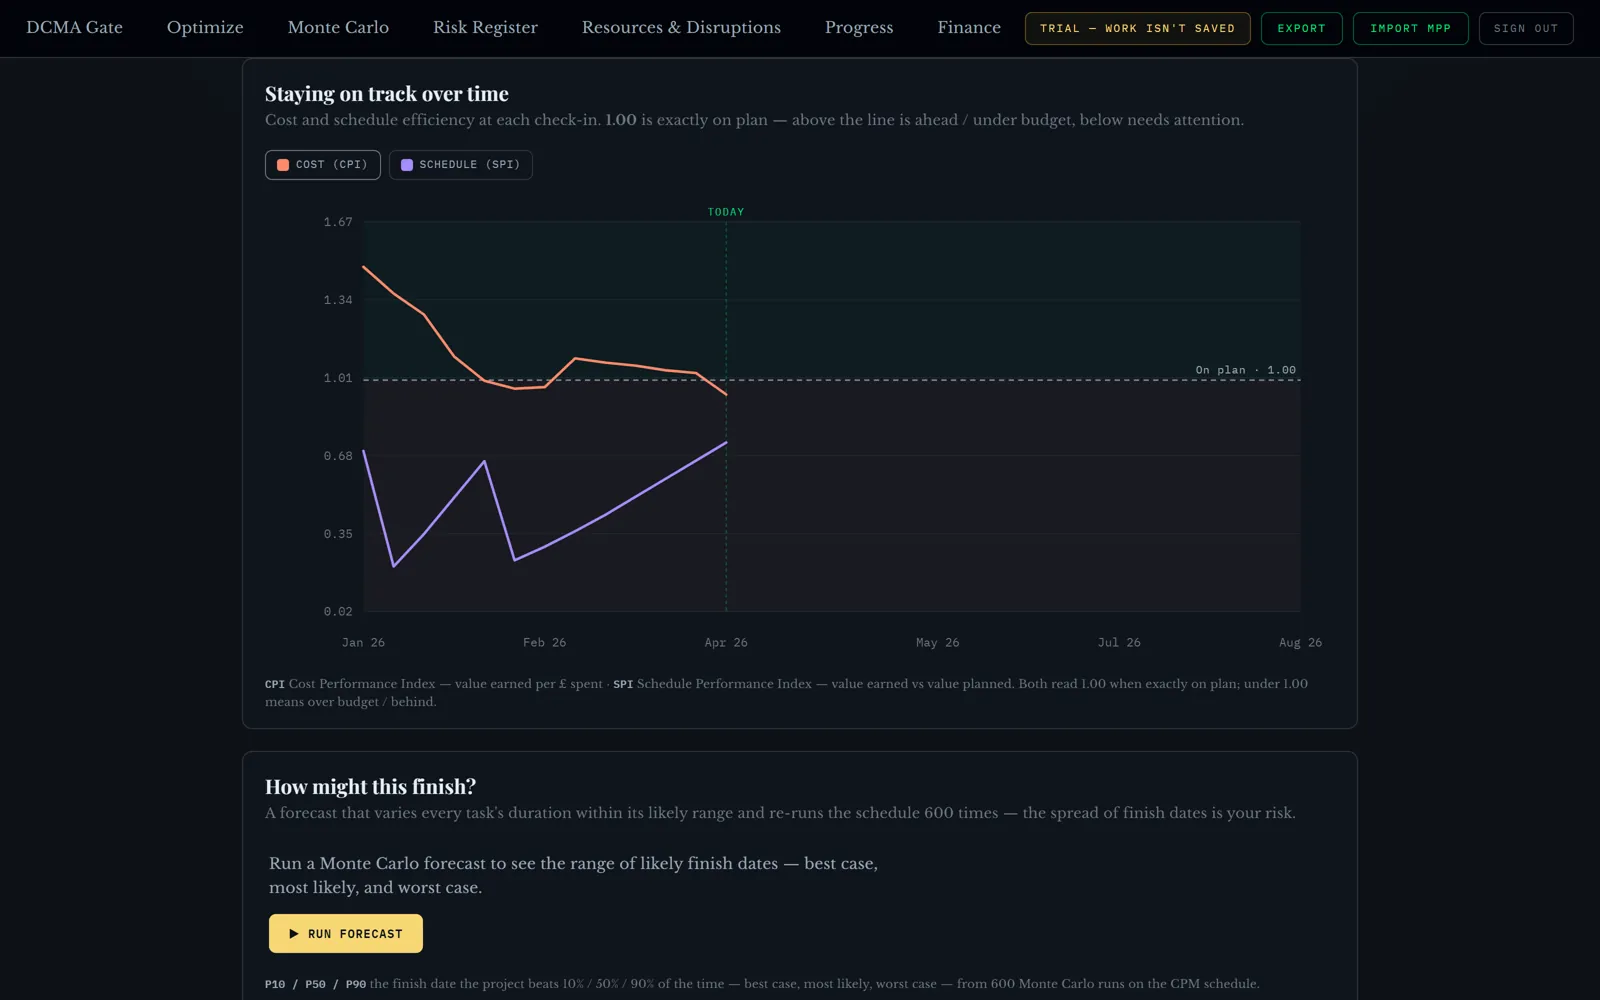
A line that has been sliding for three months is a much stronger case in a meeting than a bad month, and it usually shows up before the raw totals look alarming.
The cost of simply being there
Most of the money in an overrun is not the building. It is site staff, cabins, welfare, temporary power, plant on hire and scaffold, running week after week whether or not anything productive is happening.
The tool maps that and prices it: on this programme, every week of programme costs £4,790 in indirects. In Lean terms it is entirely non-value-adding, and all of it stops the day the job finishes.
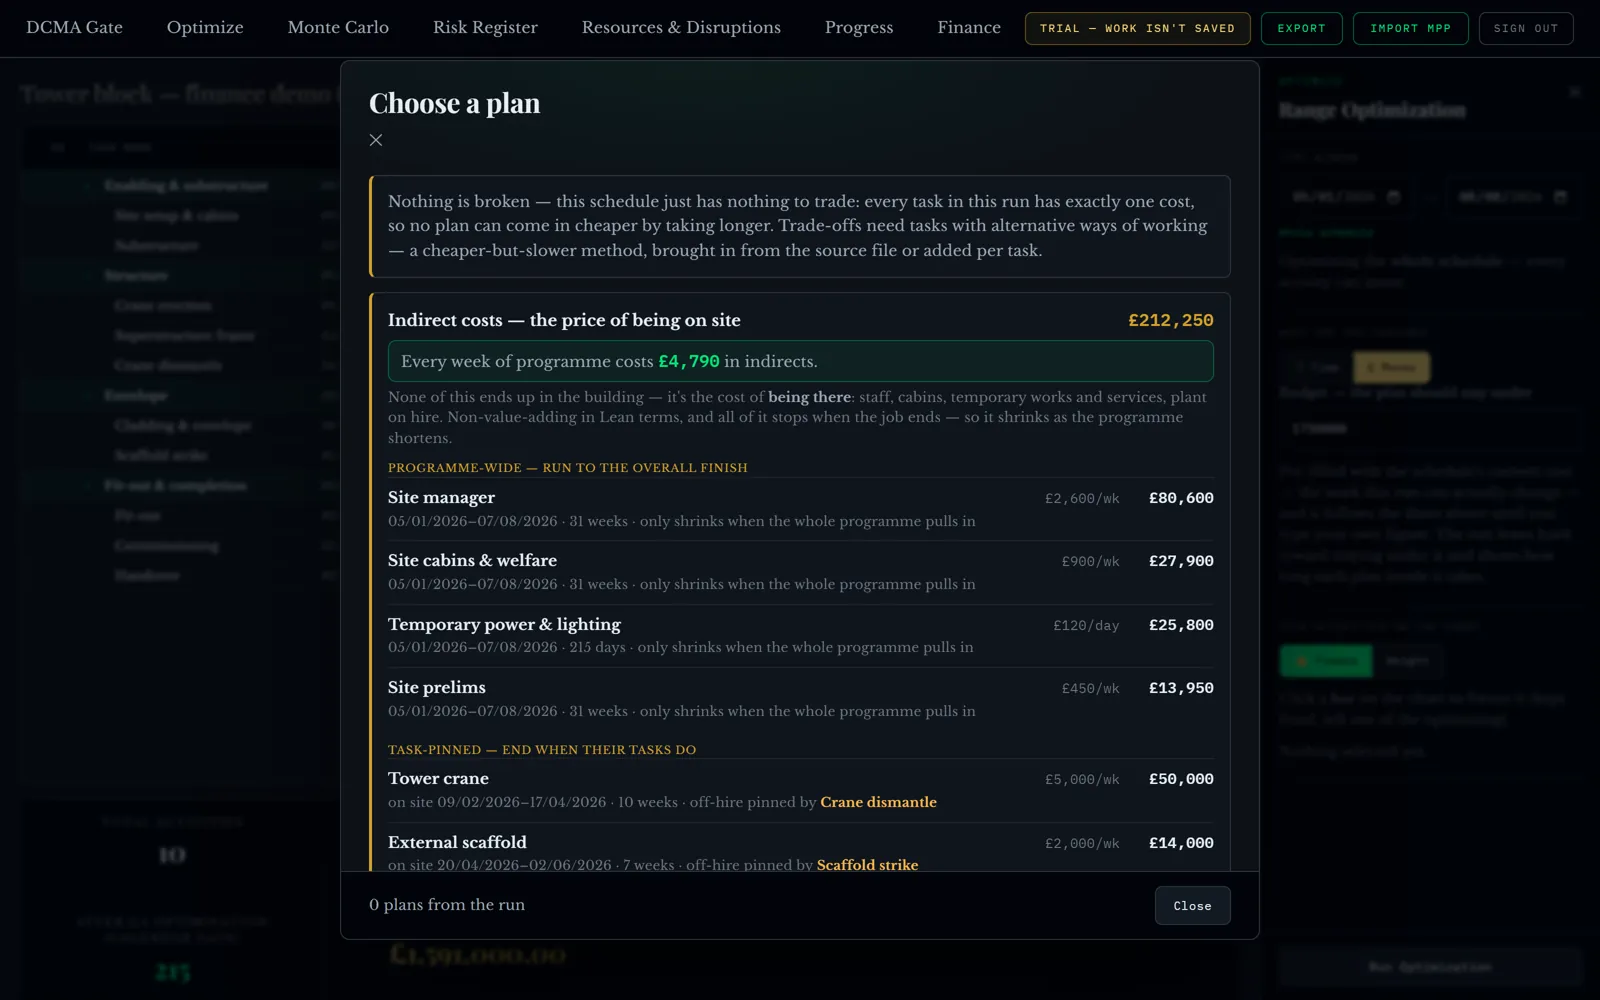
Then it goes one step further than reporting the cost: it finds what shortens it. Finish the activities holding the scaffold on site earlier, strike it sooner, save £9,700 — proven by re-running the schedule rather than estimated on the back of an envelope. You tick the moves you judge safe; the tool does the arithmetic and logs the risk each one introduces.
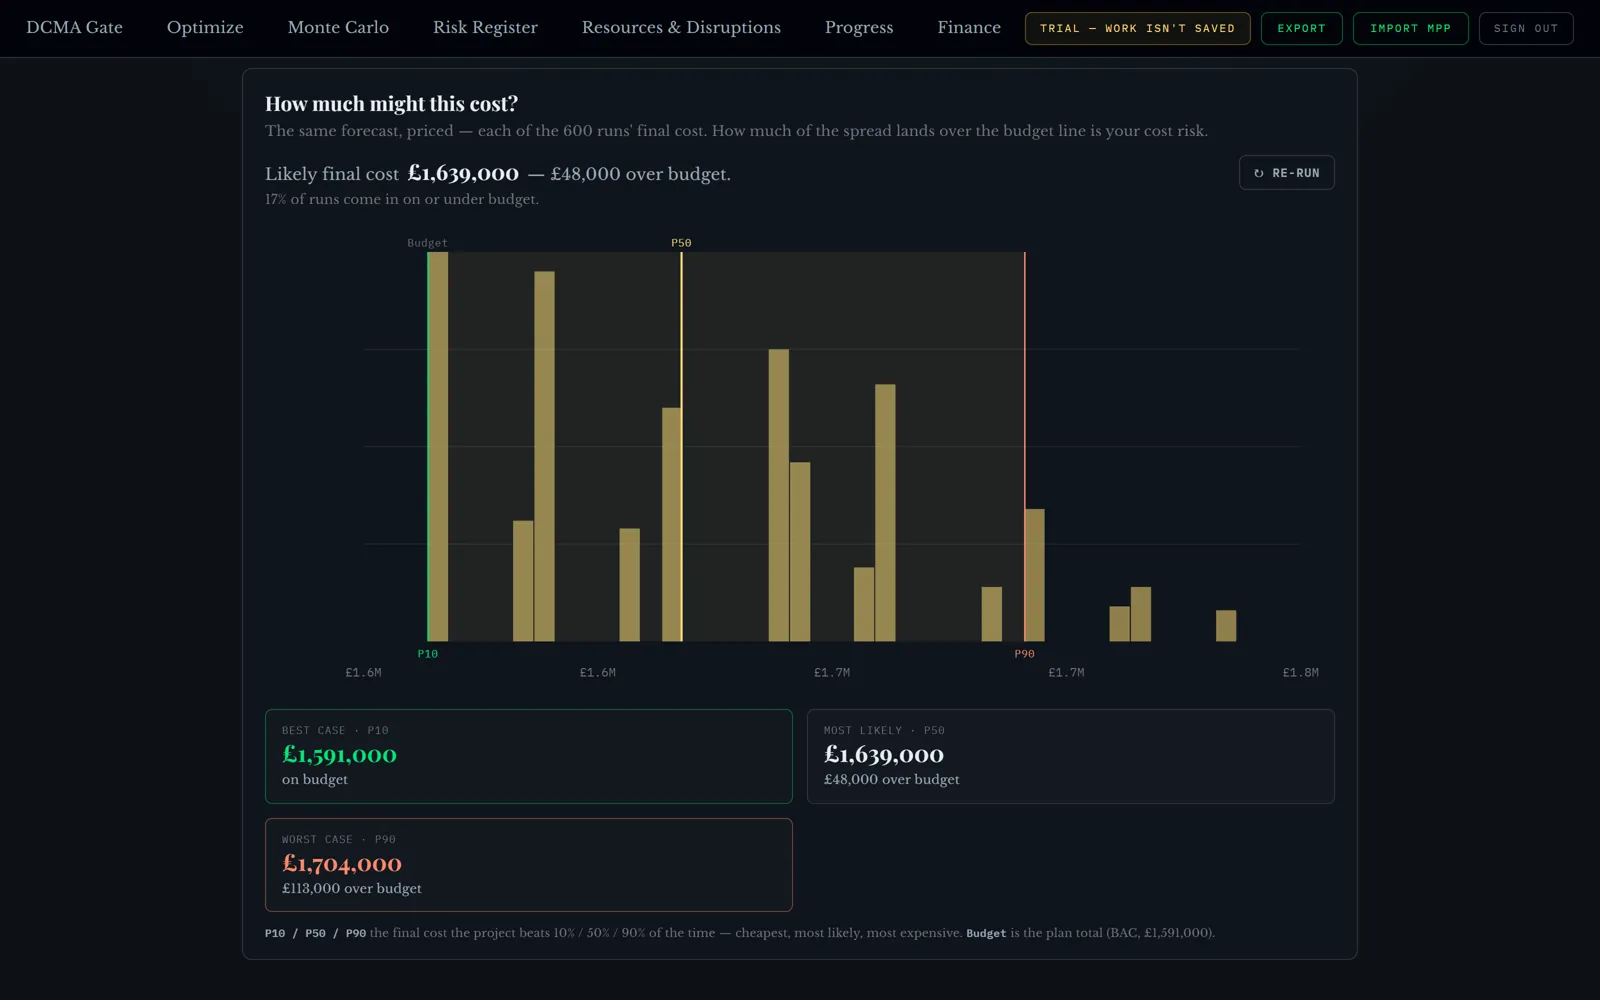
How much might it actually cost?
A single forecast figure is a hopeful number. The same forecast, run six hundred times with every activity varying within its likely range, gives you something you can commit to.
And the time twin of the same run:
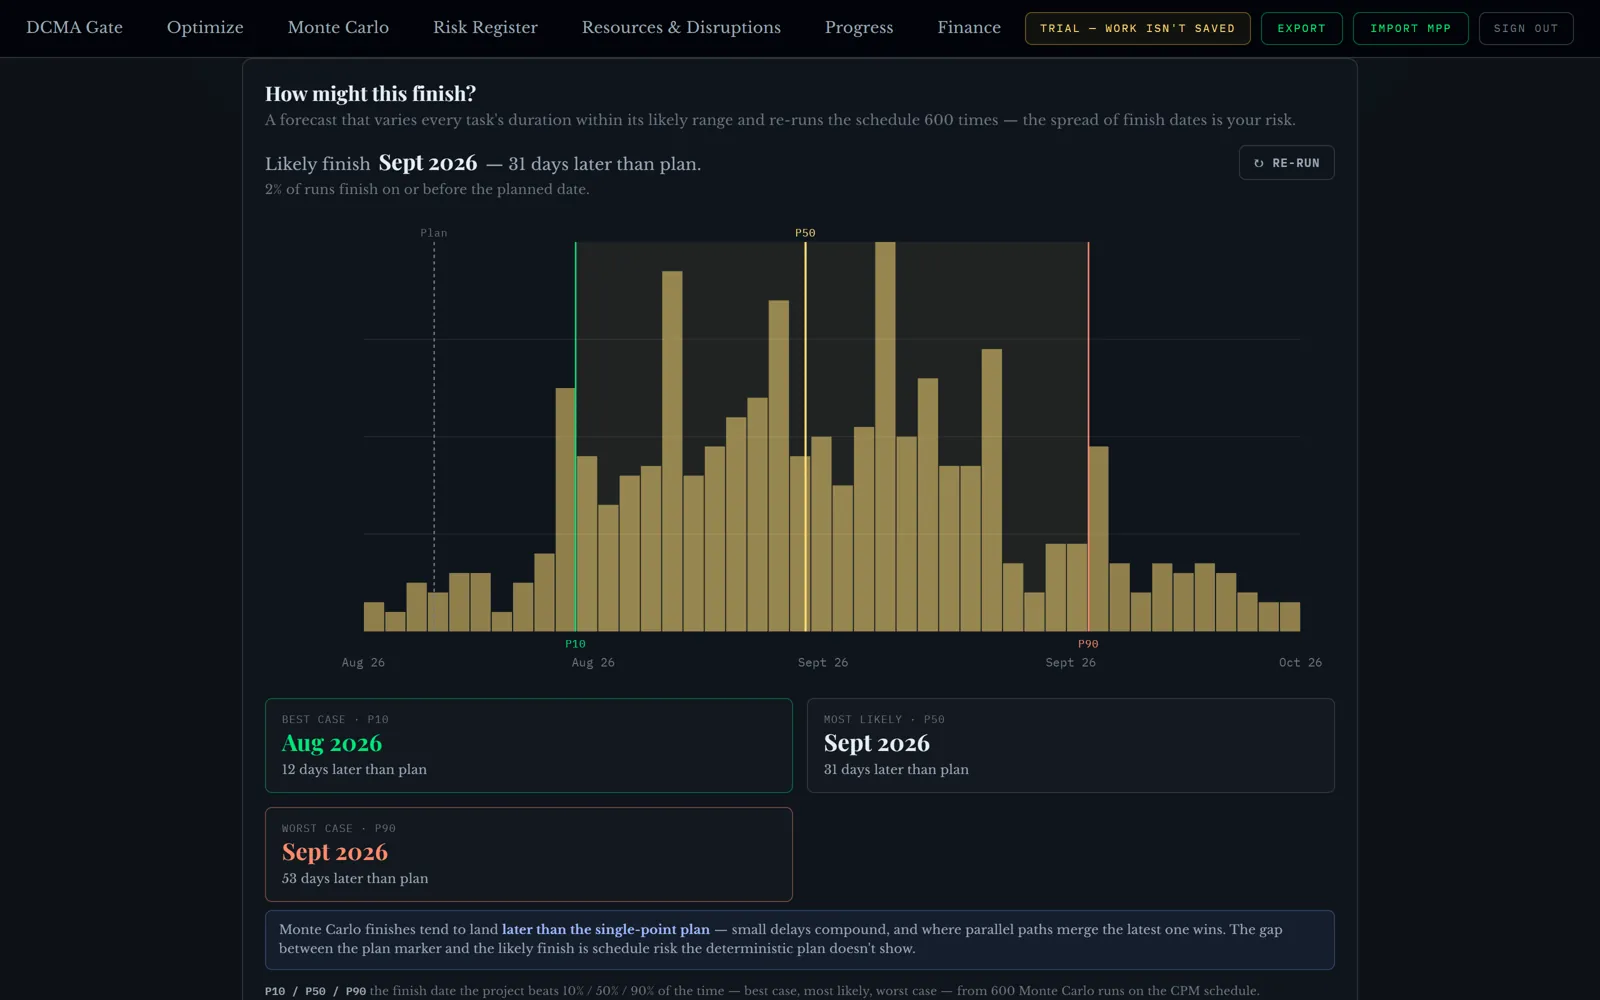
That note matters. Monte Carlo finishes are usually later than the programme says, because delays compound and the latest path always wins. A tool that hides that is flattering you.
One source, or it is not worth having
Every figure above comes from the same schedule and the same progress data, measured at the same stated day. The cost report cannot disagree with the programme, because there is only one set of numbers underneath.
And where there is no data yet, it says so rather than filling the gap. Inferred start dates are marked as inferred. Unpriced items are shown as unpriced rather than quietly counted as zero. That honesty is the difference between a report you can take into a meeting and one you have to defend.
See it on your own job
GeneraGantt reads MS Project, Primavera P6 and Asta Powerproject, and the earned-value and risk reports download as CSV and PDF, each stating the day it was measured at. Nothing is saved: your schedule leaves with you.
It is free while it is in testing, with a sample programme loaded so you can walk the whole money view without uploading anything.
Figures in this article come from the sample programmes in GeneraGantt.