A programme is a promise about the future, and most software treats it as a drawing. You build the bars, you print them, you take them to the meeting. The file will happily show you a date that nothing in the data supports, and it will keep showing it, week after week, until the day it becomes indefensible.
I have spent nine years on UK sites watching that happen: pharmaceutical fit-outs, hospital estates, high-rise residential, water treatment. The pattern is always the same. Everyone in the room suspects the date has gone. Nobody can prove which activities did it, what recovering it would cost, or what the honest answer is. So the date survives another month, and the argument moves on to who is to blame.
GeneraGantt is my attempt to close that gap. It is built around four questions, asked in order, and every figure below is measured on one live programme: 9,751 activities, £43.9M of costed work, 1,670 days.
1 · Is this schedule sound?
Before the chart opens, the file is scored against the DCMA 14-point assessment, the benchmark used across defence, infrastructure and major construction. Four of the checks are treated as critical, because they are the ones where the schedule's own arithmetic cannot be trusted. The other ten are advisory: they degrade quality without making the maths meaningless.
This programme passes 10 of the 12 checks that apply to it. It fails on unlinked logic and on high float. Six point two per cent of its activities have no predecessor and no successor. Those activities have no float and no criticality, so no optimiser can reason about them and no critical path that runs near them means very much.
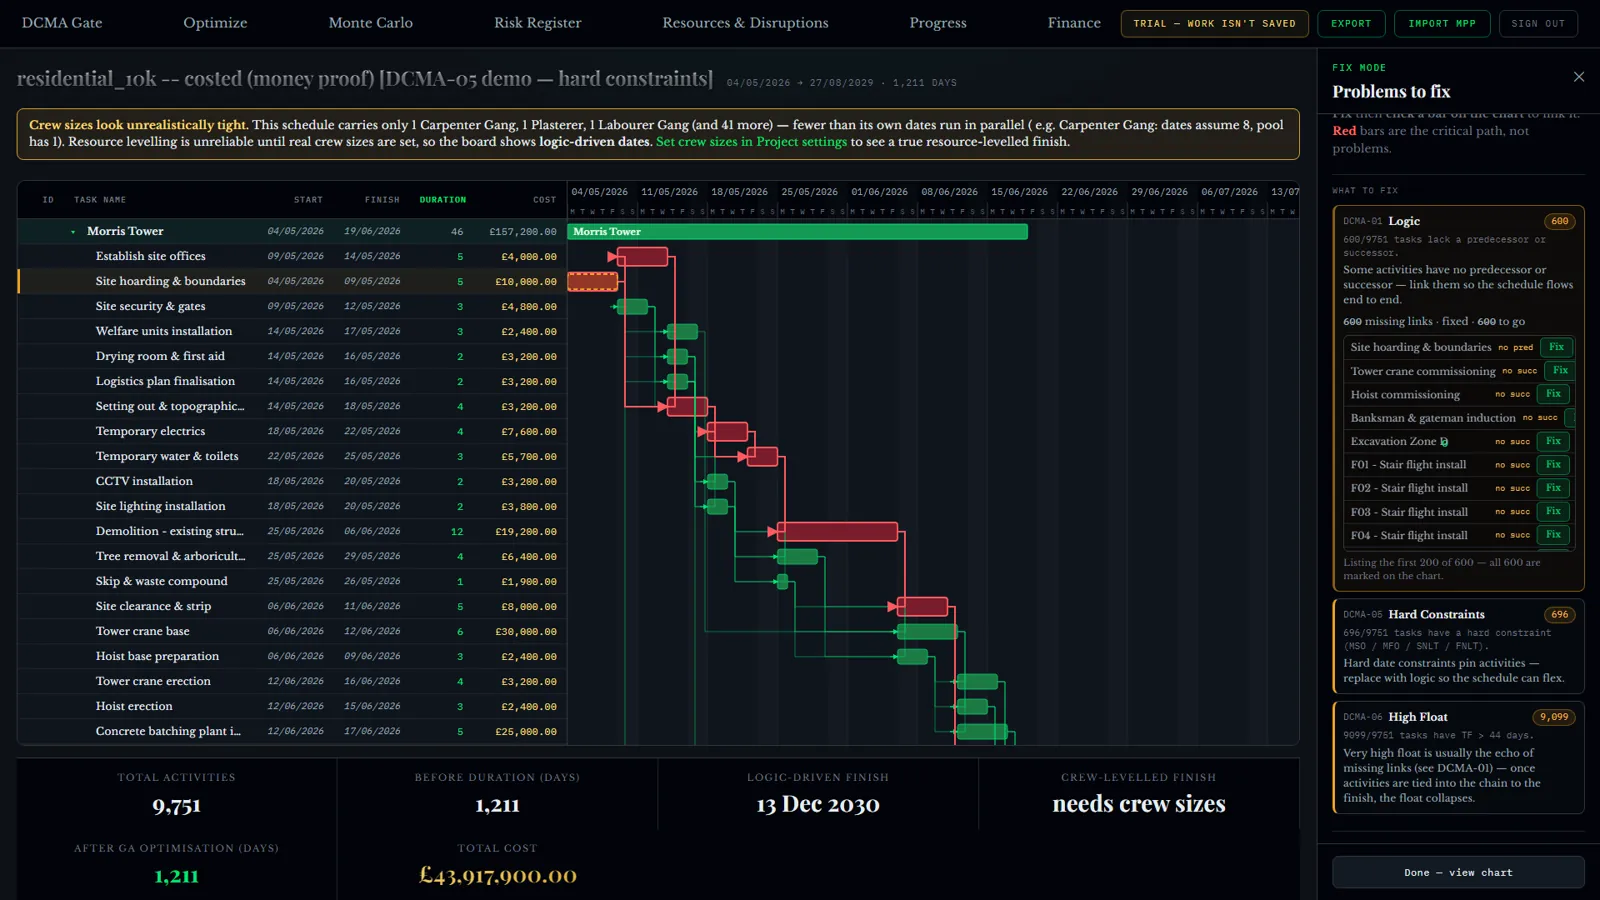
That is not a criticism of whoever built the file. It is the state of most programmes that arrive by email, including ones that have been issued, accepted and used to argue about money. The difference is knowing it before you make a promise on the back of it, rather than afterwards.
Two things matter as much as the score. First, every threshold is editable per project, because "high float" means something different on a two-year civils job and a nine-week fit-out, and a standard you cannot tune gets ignored. Second, a failing check is not a lecture: open it and you get the exact activities behind it, marked amber on the chart, with the critical path still red and separate so a problem never gets confused with criticality.
Then you fix them there. To add a missing link you click the bar you want to connect to, the way a planner actually thinks about a dependency, and the check re-runs as you go. No export to another tool and back.
2 · Could it finish sooner?
This is where the optimiser comes in, and where I have tried hardest not to oversell.
You choose what you are chasing, time or money, set the target, and pick whether to work on the whole programme or one window of it. A multi-objective search, NSGA-III, then explores the sequence and the way each activity could be done, and comes back with a front of options rather than a single "optimised" answer.
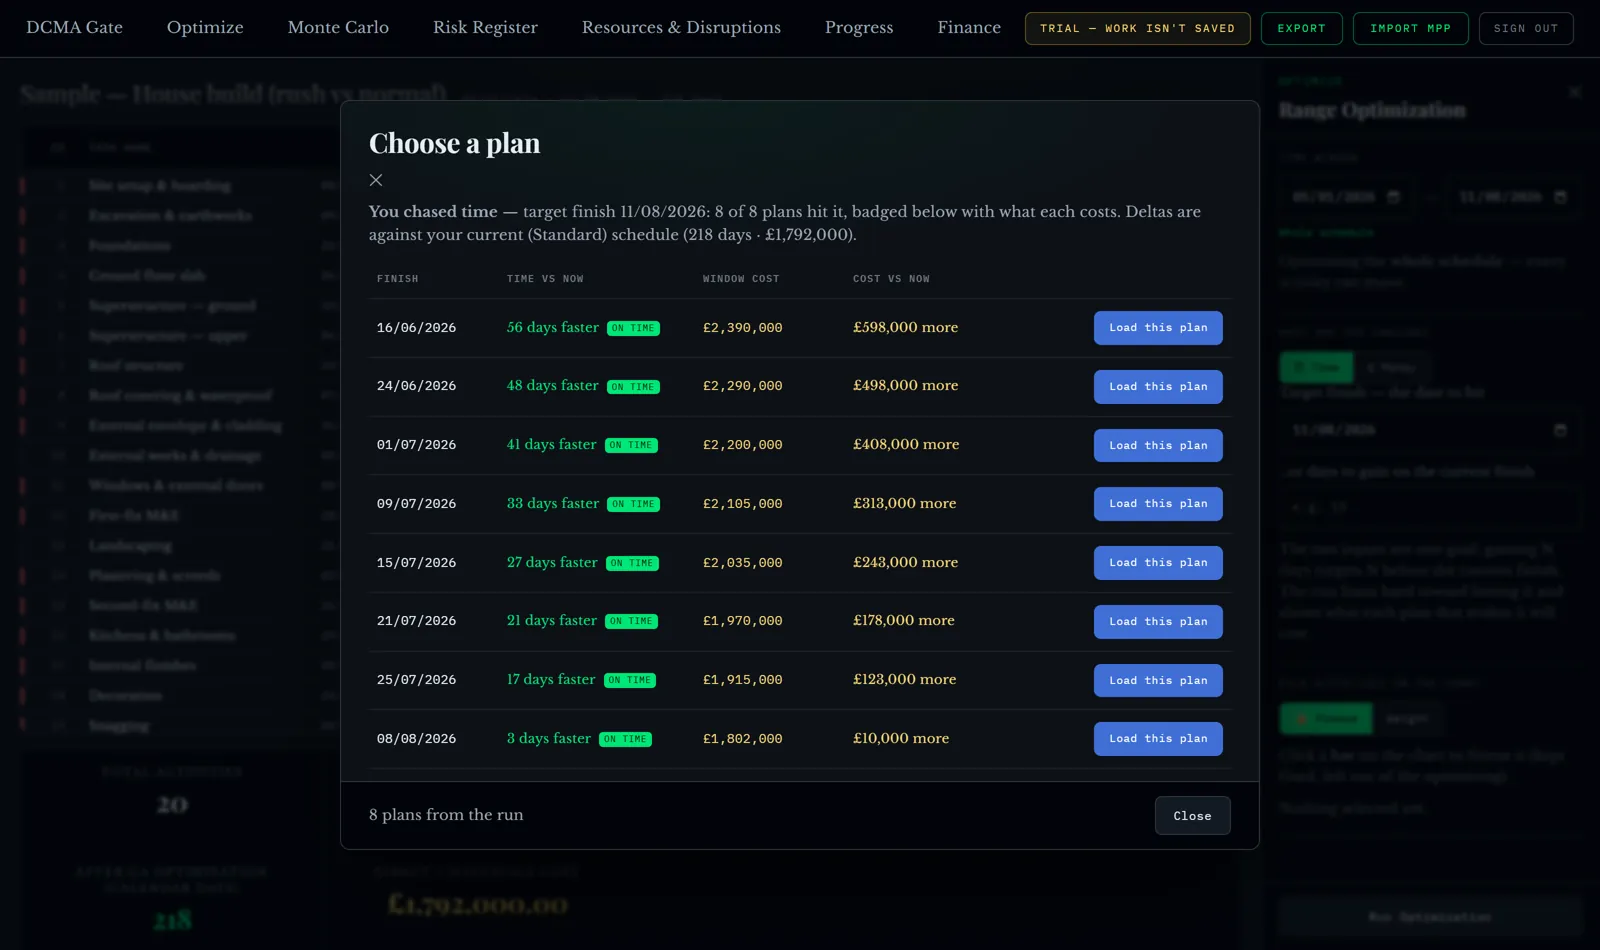
On this programme the fastest plan finishes 136 days early and costs £5.0M more. Others on the same front save a fortnight for a fraction of that. A single "optimised" schedule would have hidden the whole curve and made the choice for you, which is exactly the choice a commercial manager is paid to make.
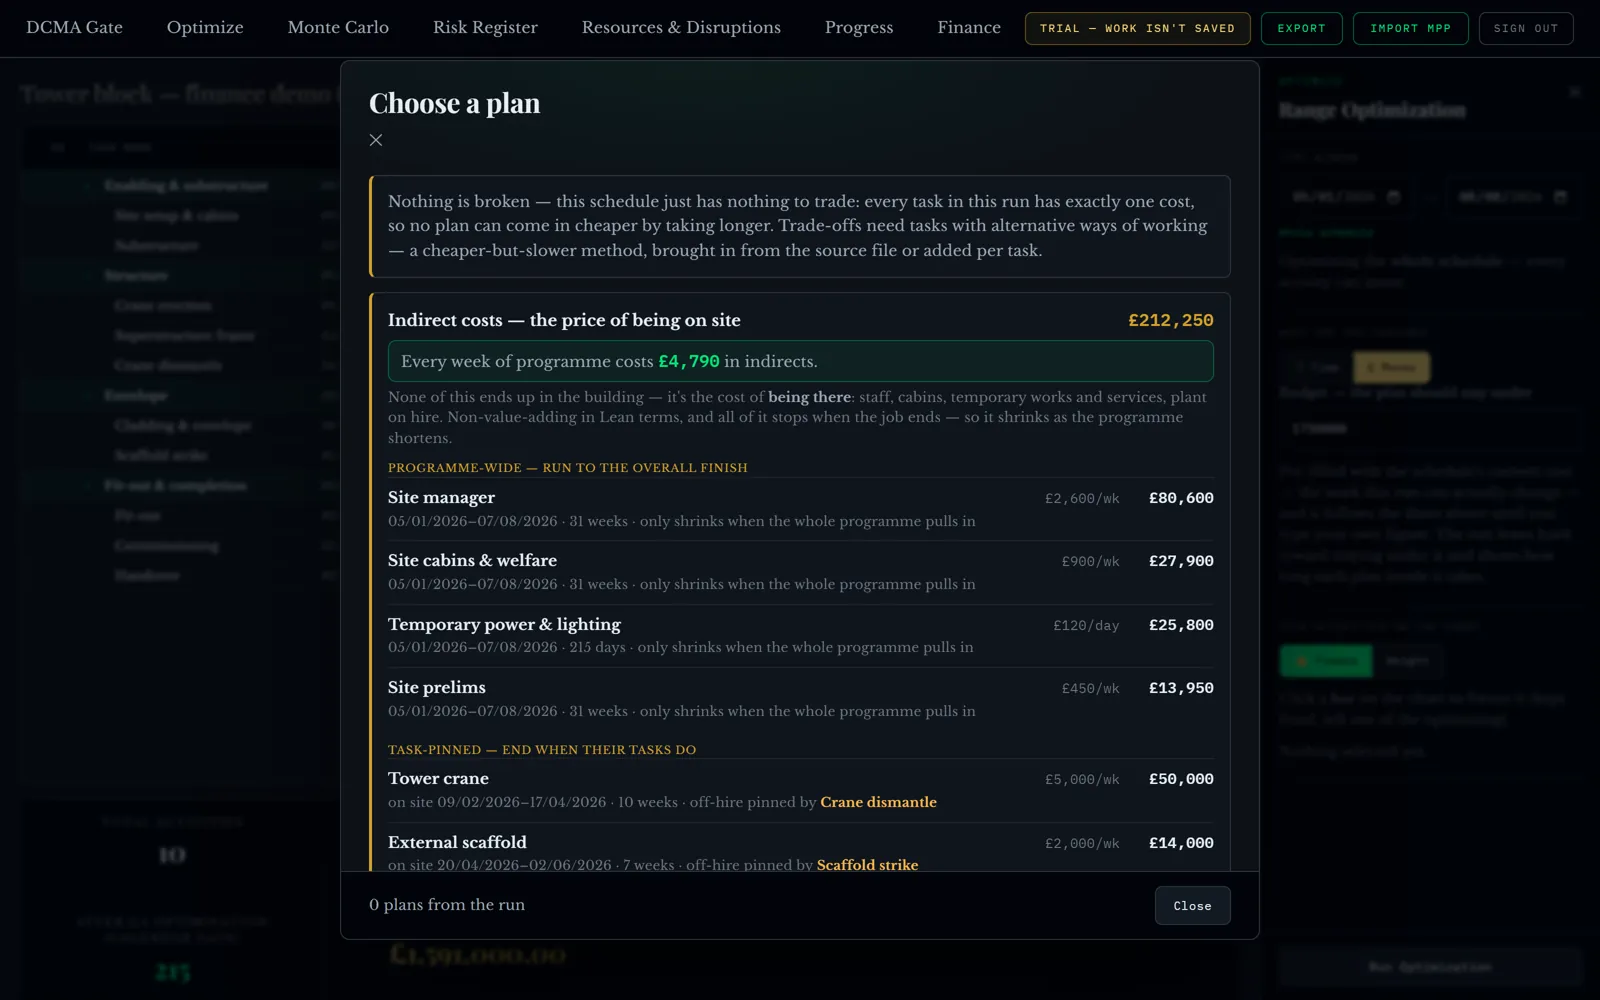
When the file carries only one way of doing each activity, which is most imported files, there is nothing to trade. The tool says so plainly instead of inventing a saving, and then points at what can still compress the job: adding resources, or overlapping work. Where a plan does lean on an invented faster-and-dearer alternative, the row says so, with the count of activities affected.
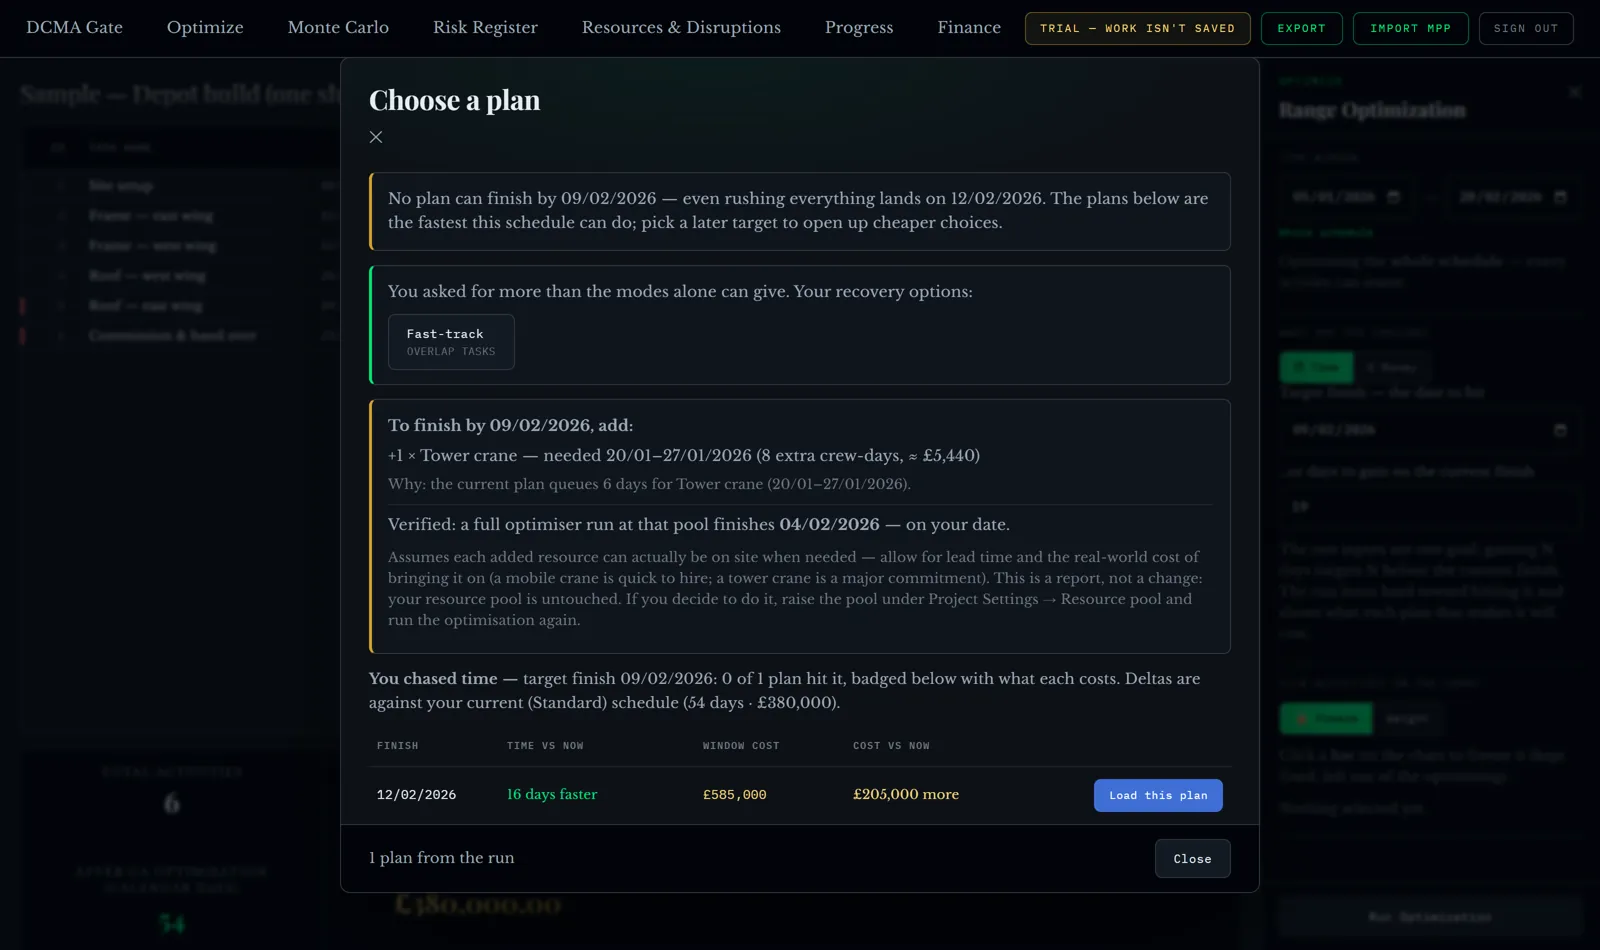
Ask for a date the current crews cannot meet and it does something more useful than refusing. It works out what you would have to add, and proves it with a real run.
3 · What will actually happen?
A single finish date is a guess wearing a suit. So every activity varies within its likely range, every logged risk fires at its own probability, and the schedule re-runs two thousand times.
The honest reading of this programme: its own 1,670-day finish is reached in none of the two thousand runs. Not rarely. None. At 80 per cent confidence the finish is 1,802 days, and the logged risks add eight days and £723,490 on top of that.
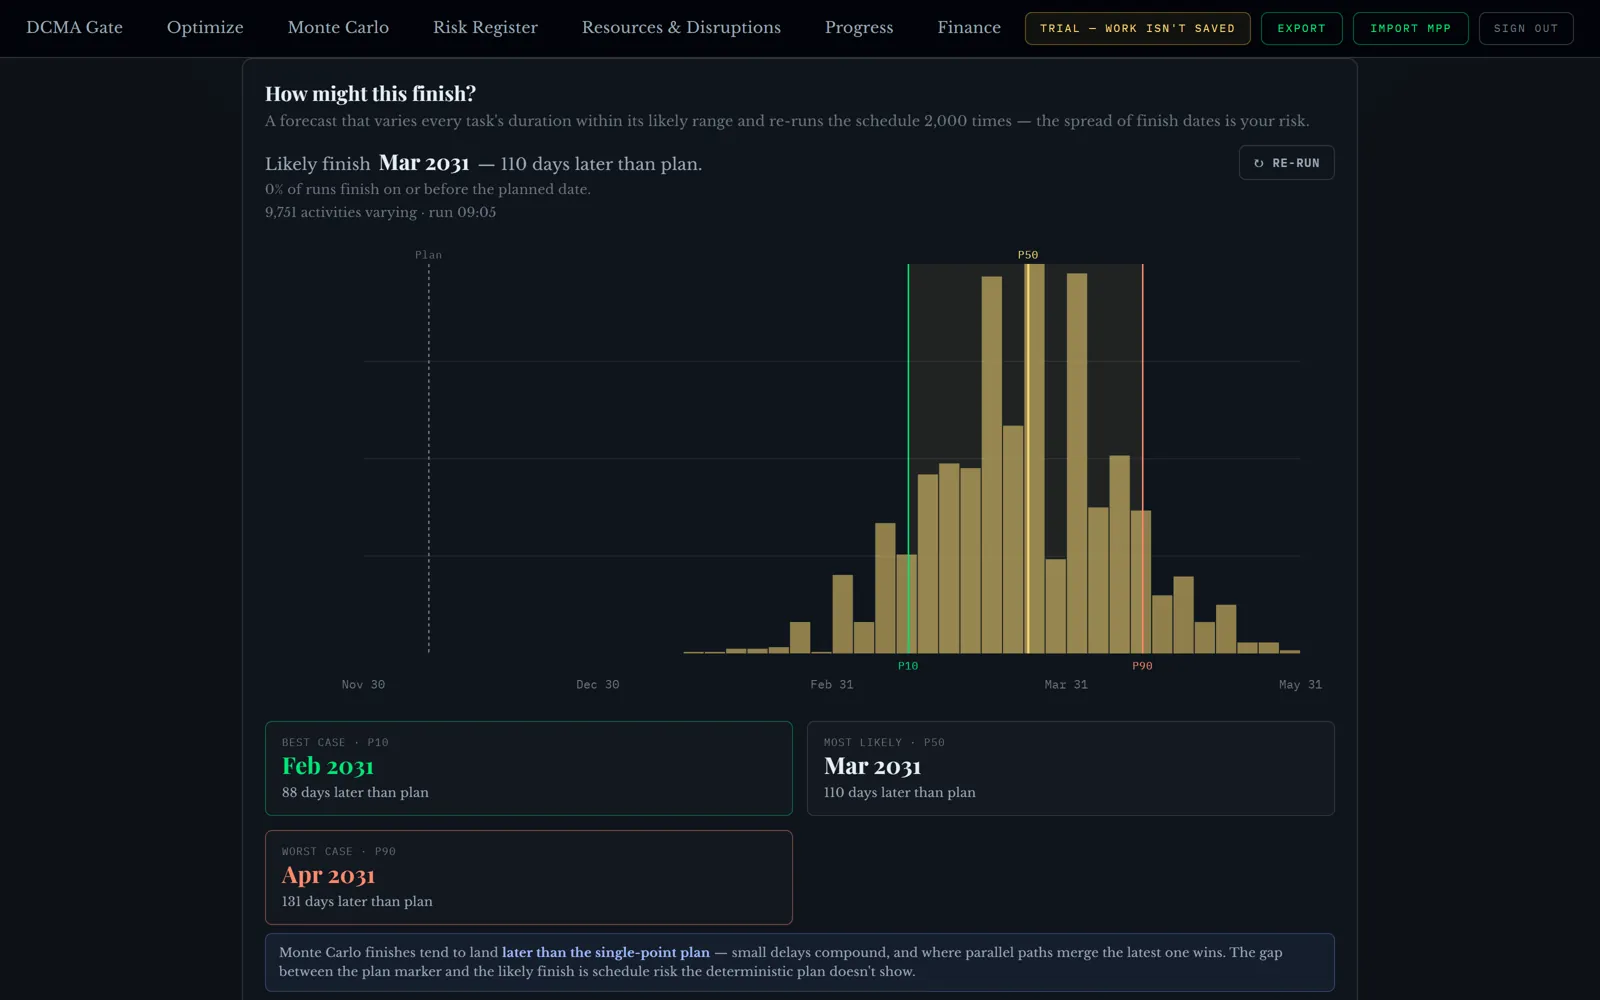
You can also ask it backwards, which is how clients actually ask. Type a confidence — "I want to be 80 per cent sure" — and get the date. Type a date and get the odds. It works the same way on cost: to be 80 per cent sure, stay under this figure.
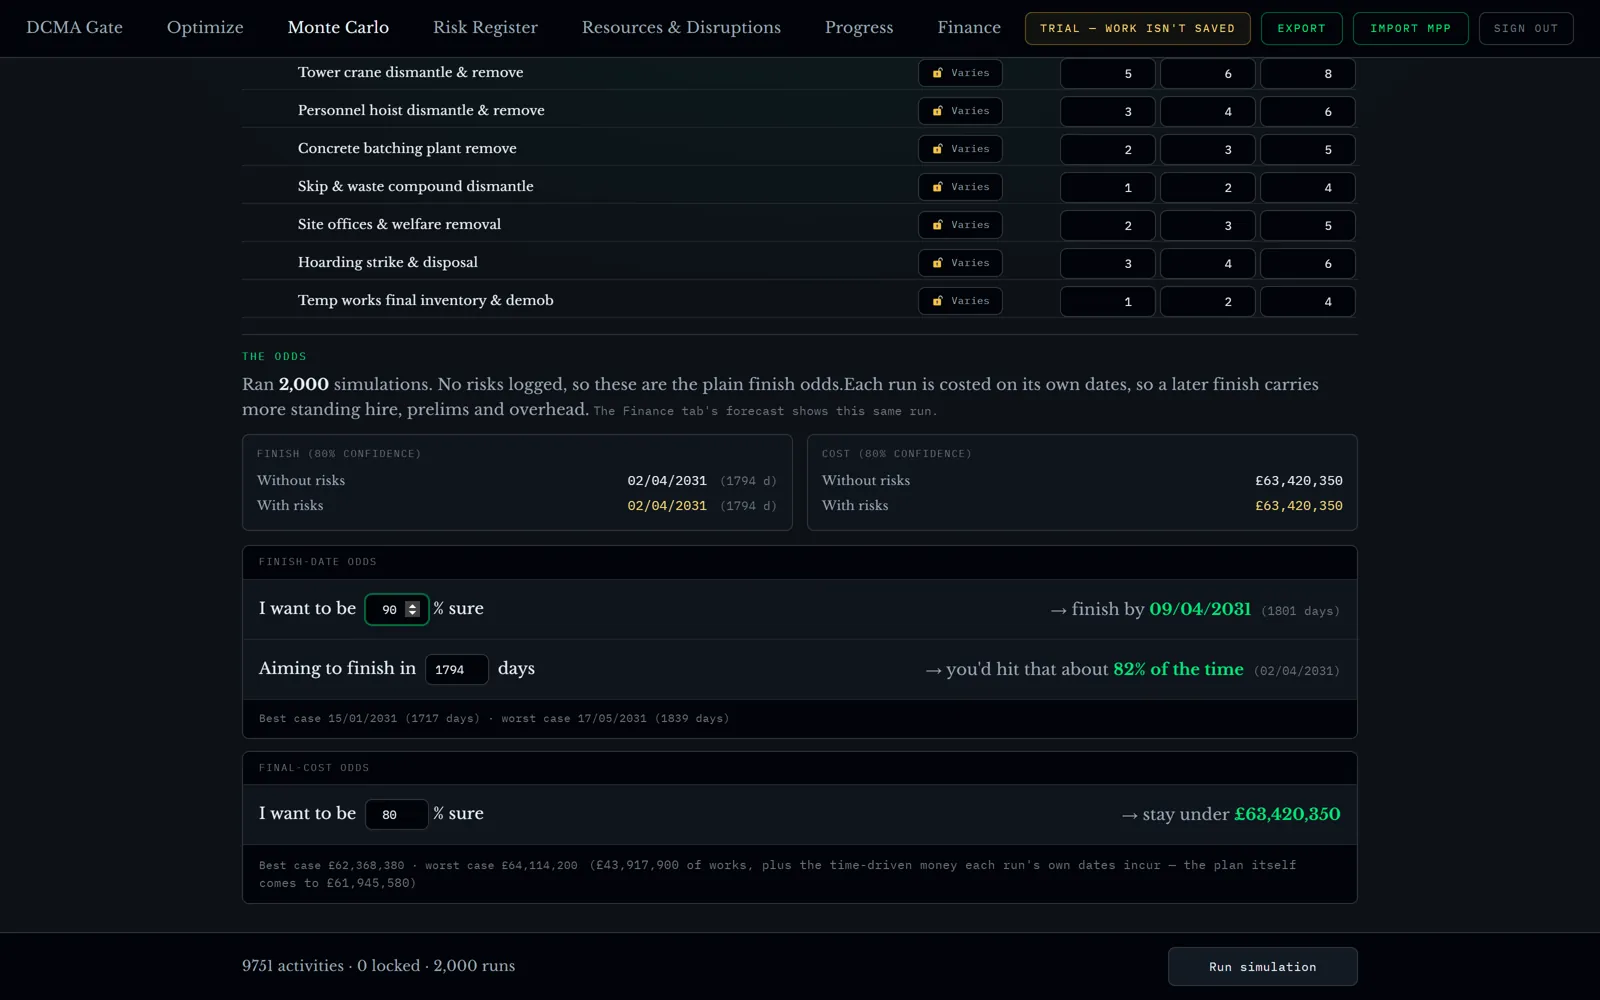
Not everything is uncertain, and pretending otherwise is its own kind of dishonesty. Lock a contracted milestone or a committed date and it stops varying, the rest flex around it, and the spread tightens. It is a fair way of showing what certainty is worth, in days.
The register and the odds cannot disagree
Most risk registers are a colour-coded spreadsheet written once for the tender and never opened again. Amber has never saved a programme. This one prices each risk in the units the job runs on, days and pounds, and links it to the activities it actually hits, so it lands once on the critical-most activity it touches rather than once per task.
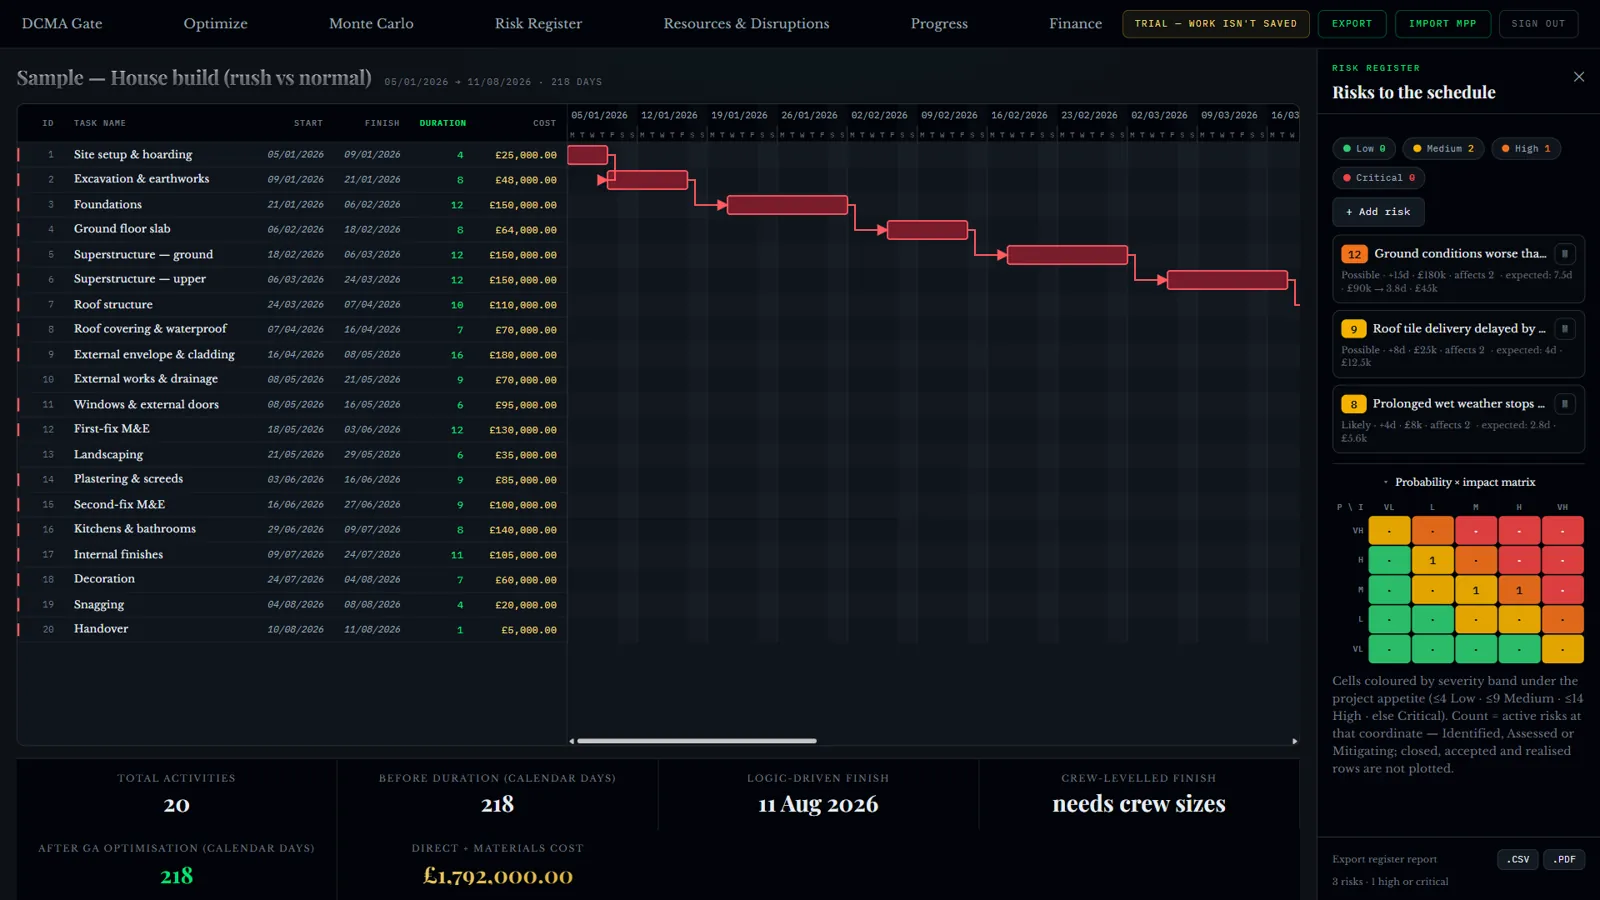
A mitigation only shrinks the forecast once it is marked implemented. Proposed and in-progress mitigations are tracked and costed and change nothing, because planned is not done, and a register that lets you bank work you have not done is worse than no register. The same register feeds the simulation, so the report and the odds can never tell different stories.
4 · How is it going?
Percent complete tells you what has been done. It does not tell you when you will finish or what it will cost by then.
So progress goes in as one card per activity that was due to have started by the reporting day — 3,214 of the 9,751 here, not ten thousand rows to scroll. Every entry is kept with the date it was reported. Nothing is overwritten, so a wrong figure can be removed and the one before it takes over, with the forecast and the money following it.
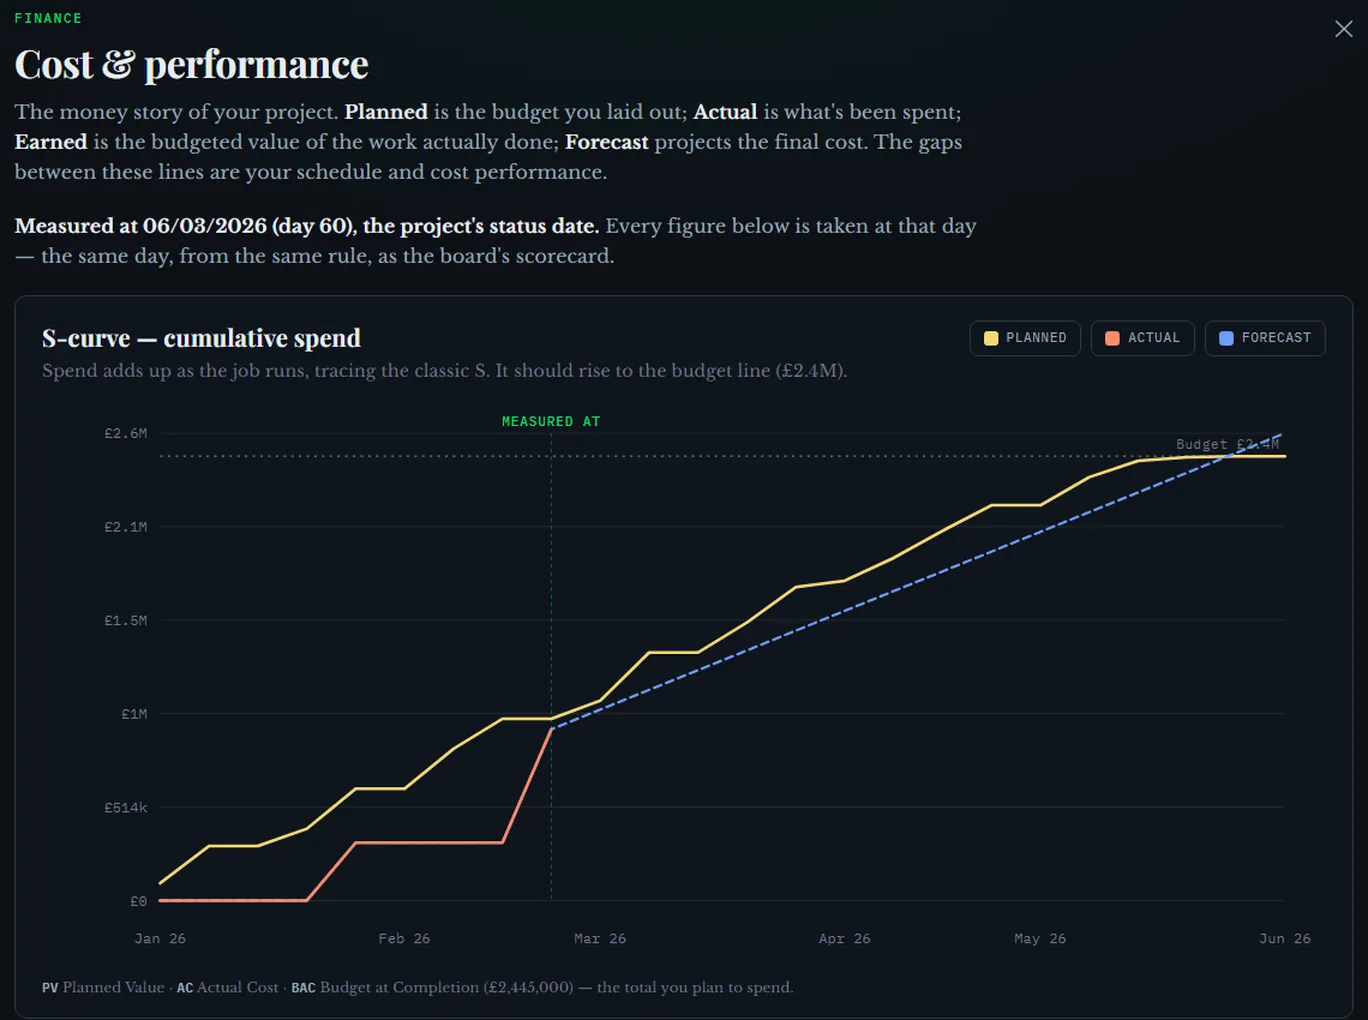
At day 835 this programme is 43 days late and £865,033 over, judged against the plan of record rather than the programme that happened to be imported, with the five activities dragging it listed in days. SPI is 0.90 and CPI 0.94, and both are written out in pounds underneath, so nobody in the meeting has to remember which index is which.
Move the measured-at day back and every figure recalculates as it stood then, excluding what was only found out later, and it says how many things it excluded so a look-back never gets mistaken for missing data. That is what turns one arguable snapshot into a trend you can defend.
Where the money actually goes
Most of the money in an overrun is not the building. It is the cost of being there: staff, cabins, plant on hire, scaffold, running week after week. The tool maps it and prices it, then goes one step further and finds the moves that release it, proven by a real schedule re-run rather than an estimate.
What it will not do
It will not resource-level a file that cannot support it. This programme carries one carpenter gang where its dates assume eight, so levelling it would be fiction dressed as a plan. The tool shows logic-driven dates, says why, and tells you what to set.
It will not invent a saving on a single-mode schedule. It will not present an inferred start date as a recorded one: where somebody reported an activity half done but never typed a start, the tool has to assume one to forecast at all, so it assumes the plan's, uses it, and marks the row, the forecast and the slipping list.
Most of the design decisions in it are that shape. Say what you know, mark what you assumed, refuse to invent the rest. A guess labelled as a guess is worth something in a meeting. A guess presented as a fact is how a programme gets defended right up to the week it fails.
It is also early. I am one person building this alongside a day job on site. What is described above is what works today, not a roadmap.
Bring a programme and take the report
It reads MS Project, Primavera P6 and Asta Powerproject — .mpp, .xml, .xer and .pp — and the checks run before the chart opens, with nothing to configure first. When you are done, the chosen plan exports back to MS Project XML, Primavera XER or PMXML, and the risk register and earned-value reports download as CSV and PDF, each stating the day it was measured at. Your planner opens them in the software they already use.
Nothing is saved. The schedule lives for your session and leaves with you.
It is free while it is in testing, and a sample programme is loaded, so you can walk all four steps without uploading anything of your own.
If you plan for a living, the most useful thing you can send me is where it is wrong: a check that is too strict, a word that does not mean what it means on your jobs, or a plan it offered that no site would ever build.