Check. Optimise.
Forecast. Track.
Import, quality-check, optimise and cost a construction programme in one place, with honesty built in. It flags what it doesn't know instead of guessing.
What's wrong with the schedule you were sent
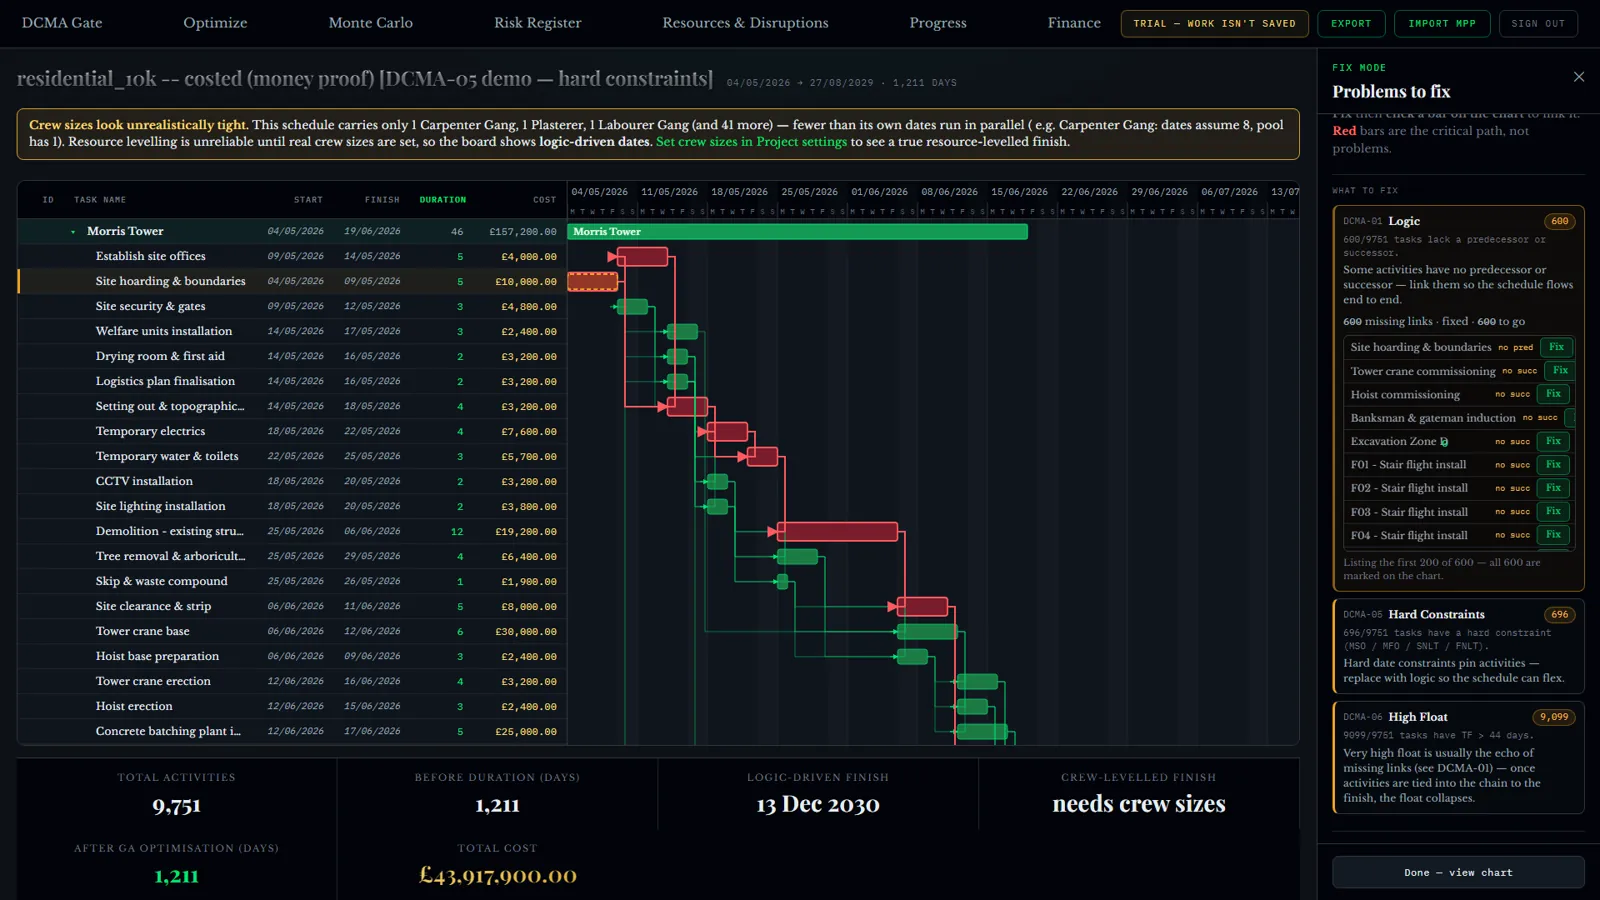
The moment a programme is imported it is scored against the DCMA 14-point standard, before the chart opens. Four checks are critical, ten are advisory, and every threshold can be changed per project.
- Measured value shown against the threshold, for every check
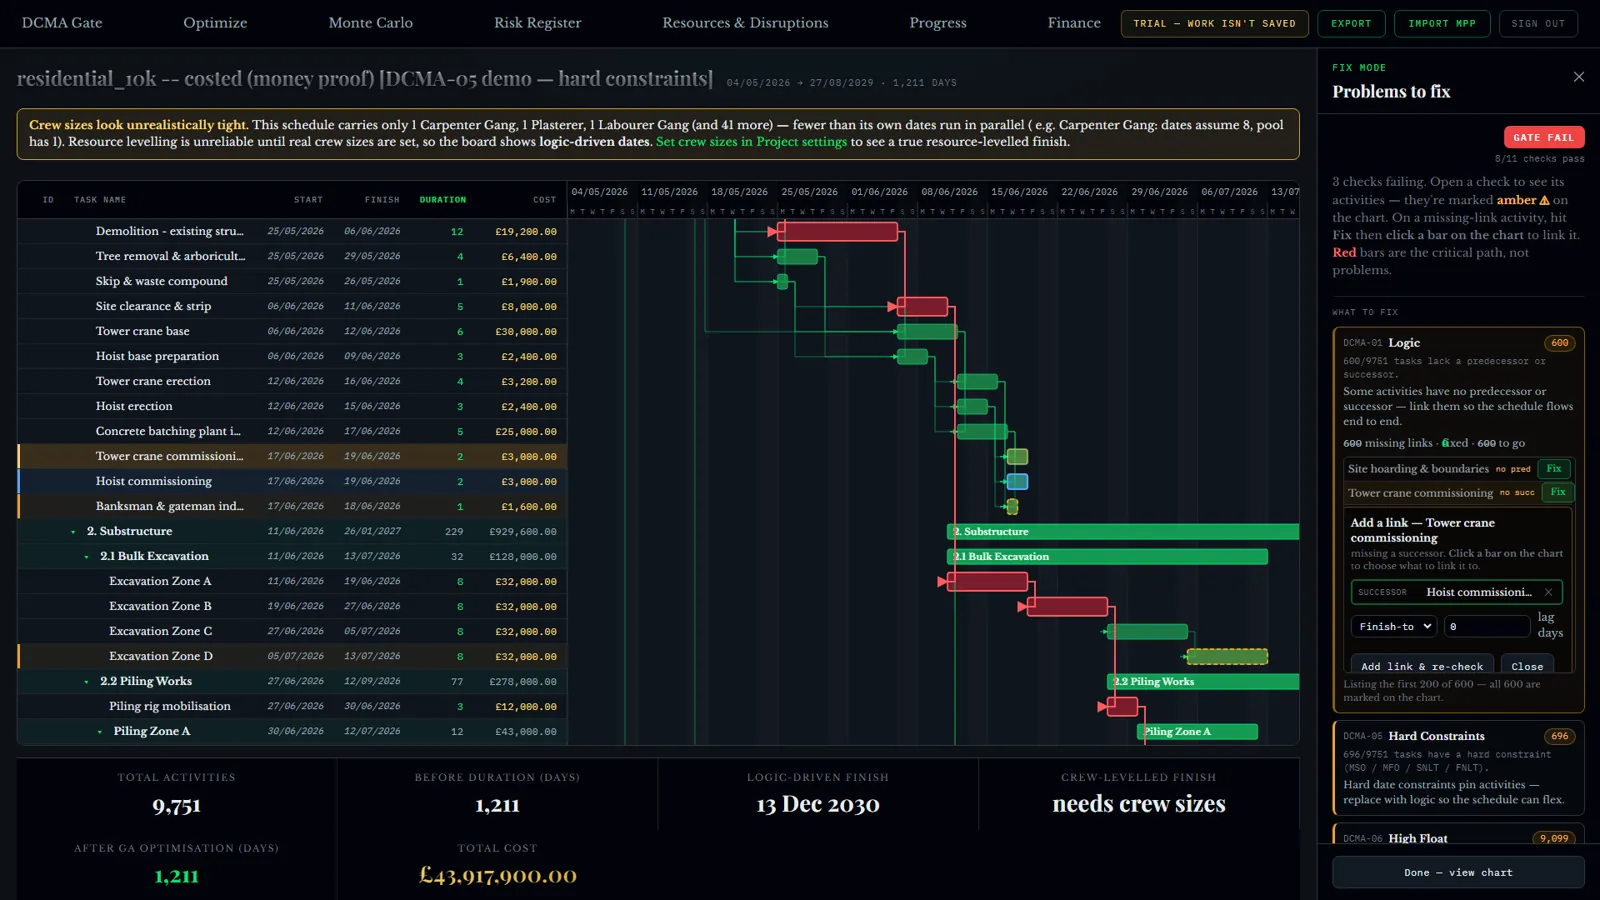
- Open a failing check to see the exact activities behind it, marked amber on the Gantt
- Fix it in the tool: click the bar to add a missing link, and the check re-runs live
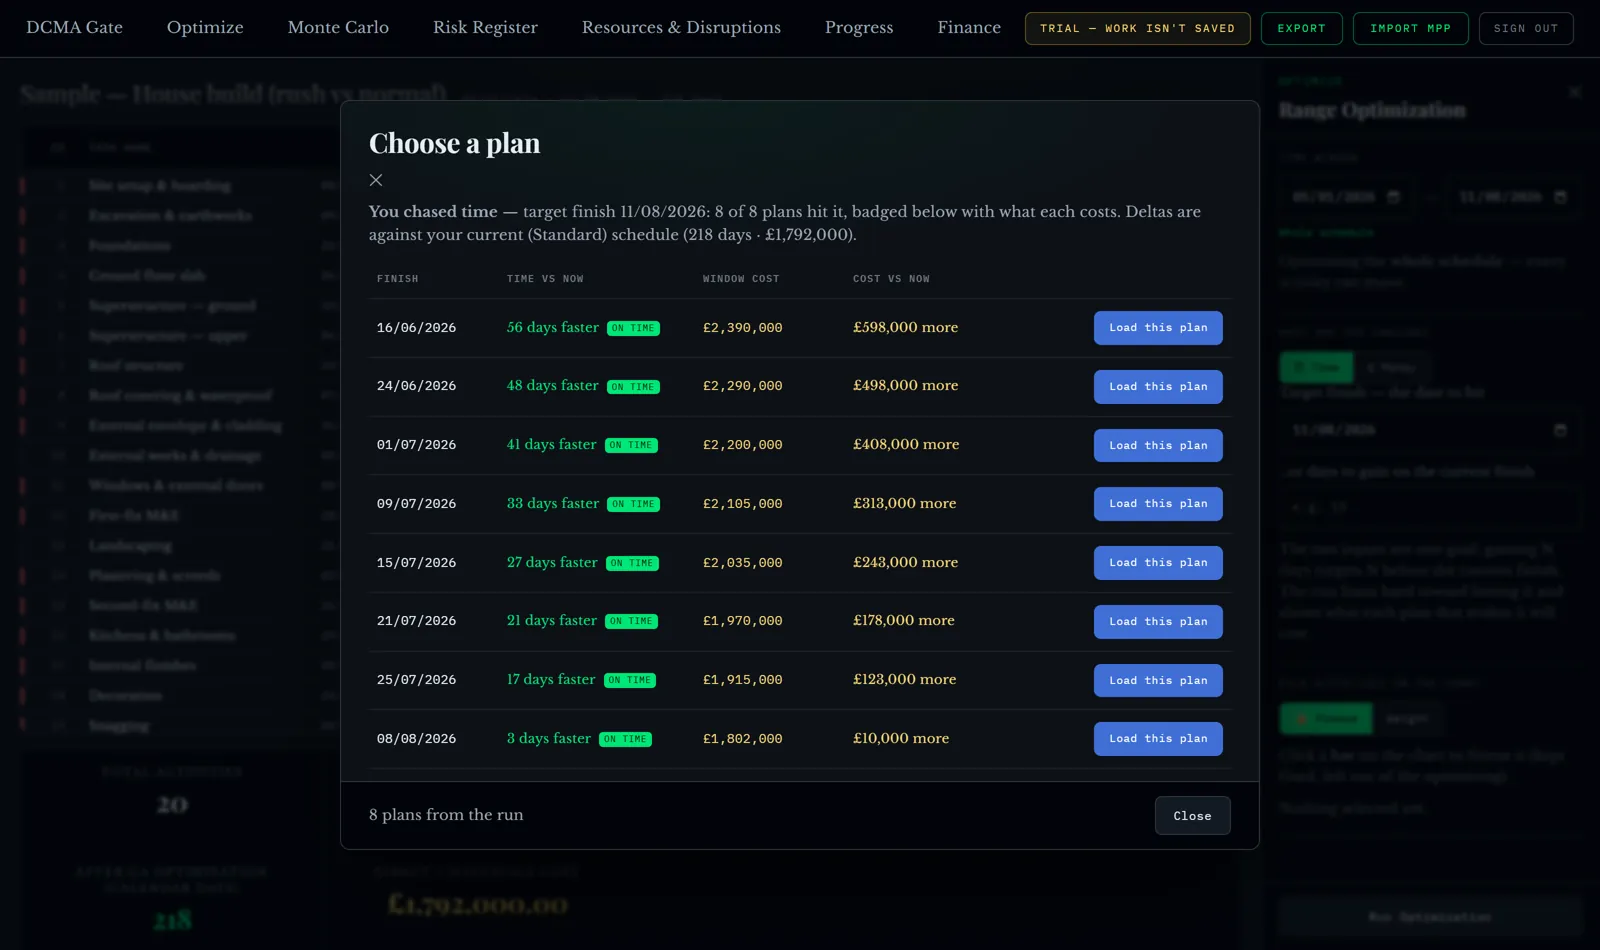
Eight ways to finish sooner, priced
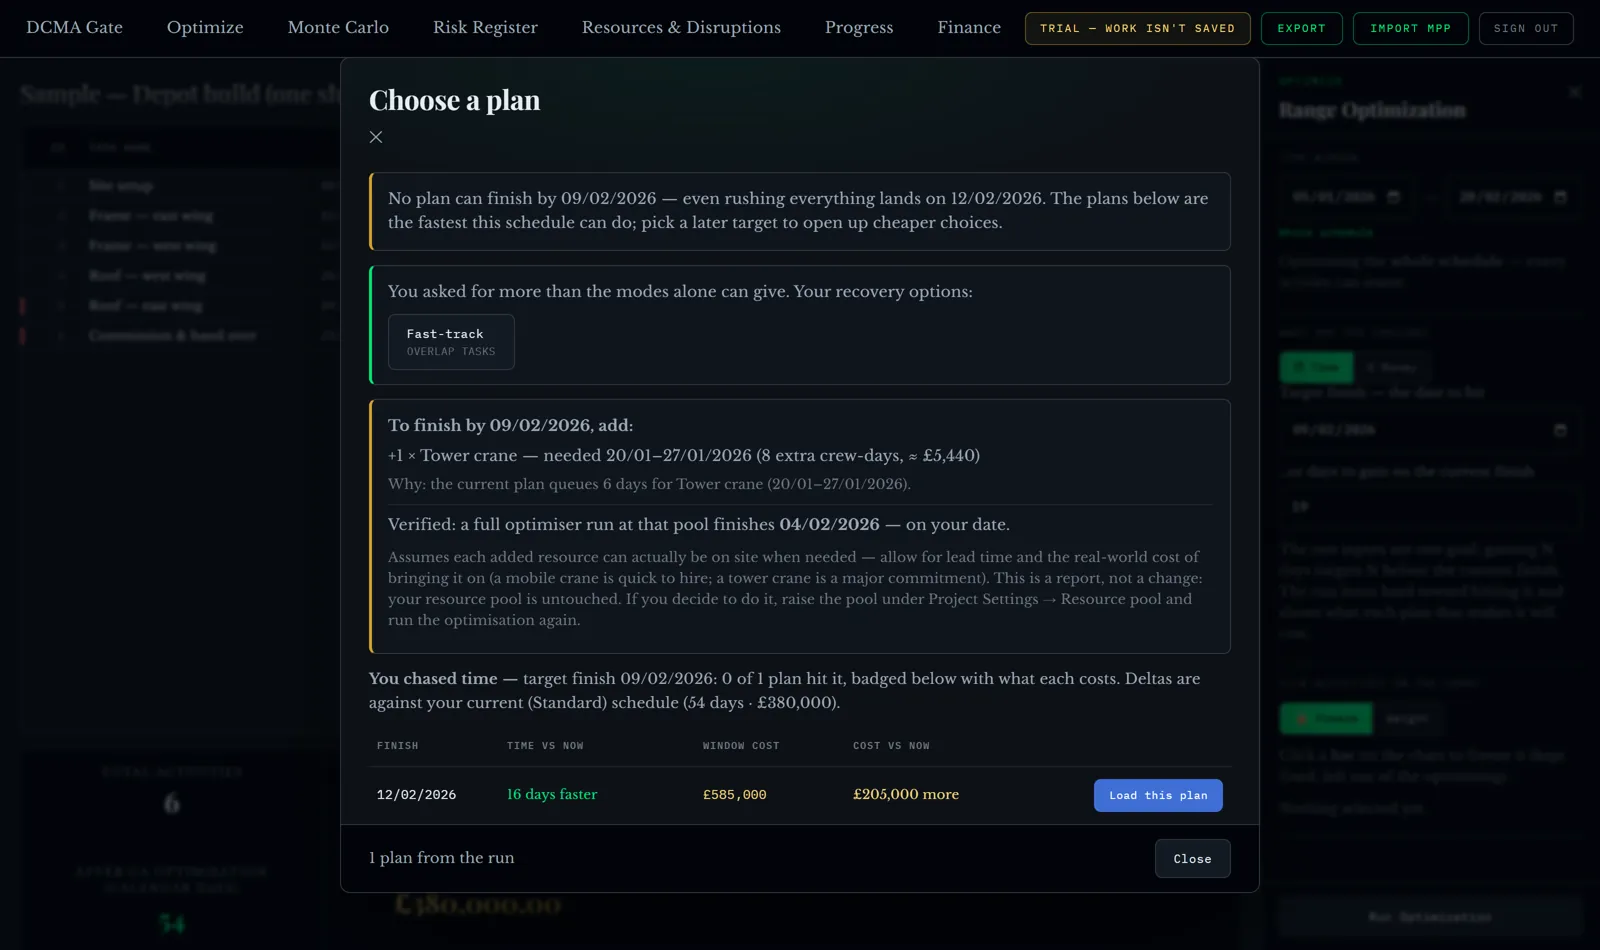
Choose Time or Money, set a target, and optimise the whole programme or one phase. The engine searches thousands of ways to sequence and resource the work and returns the full trade-off, not a single answer.
- Every plan is a real, buildable schedule with its true cost
- Ask for a date the crews can't meet and it tells you what to add, such as one tower crane for a set week at a set cost
- If there's nothing to trade, it says so and points to what can still compress the job
The date you'd actually hit
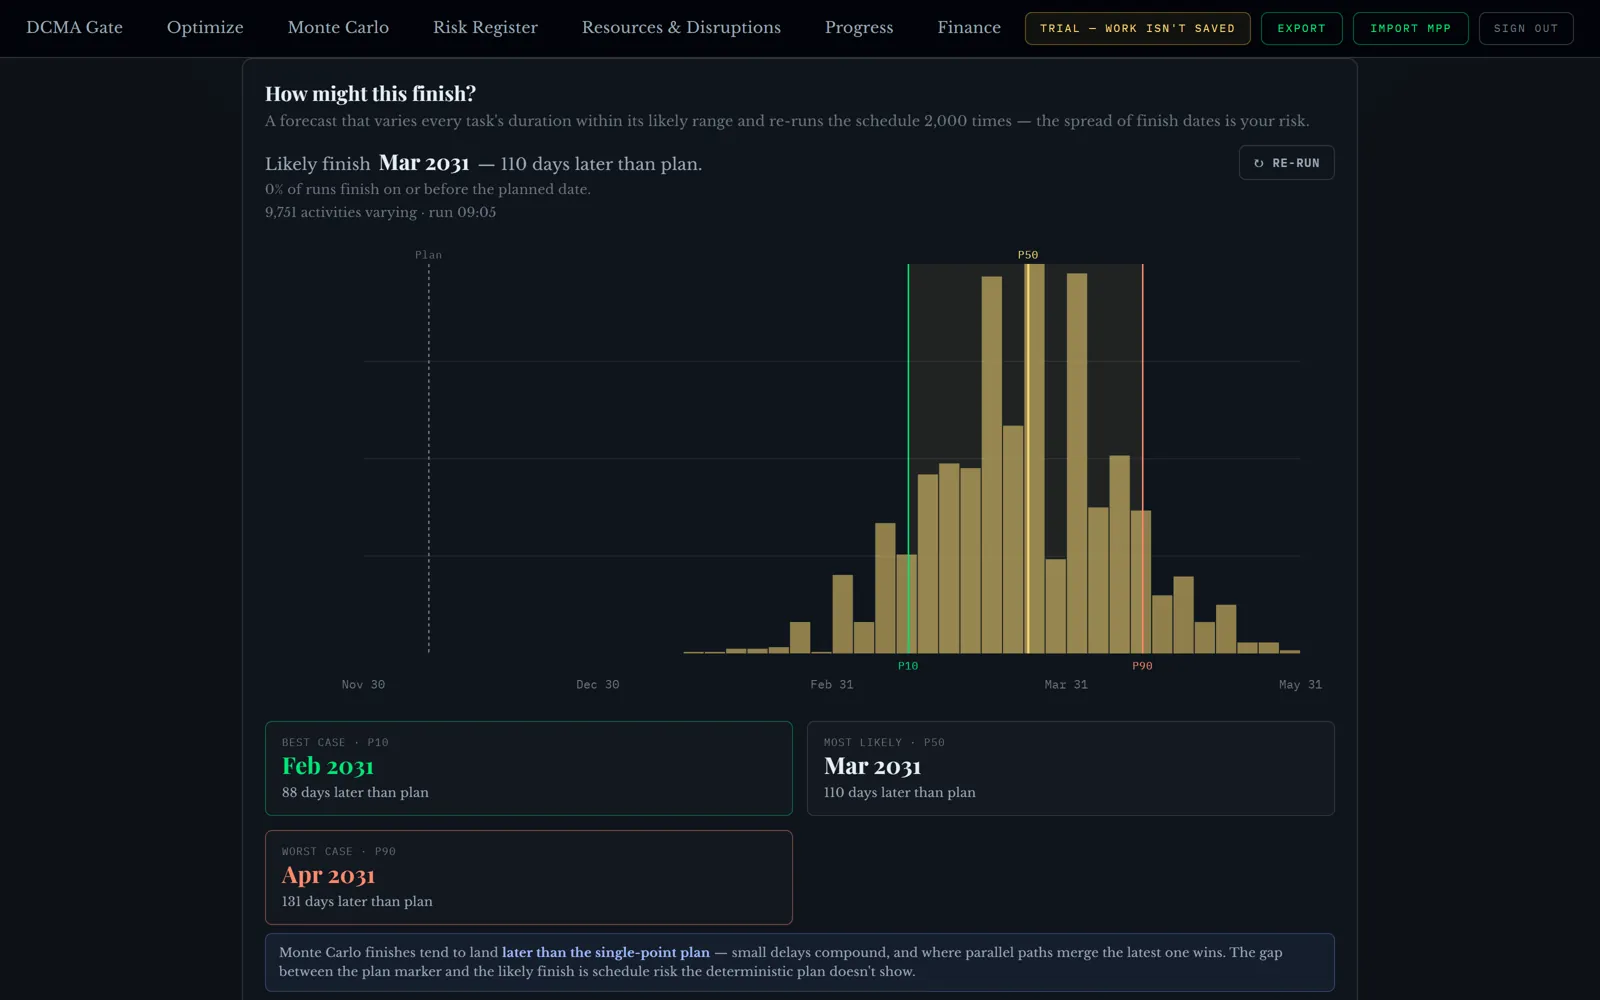
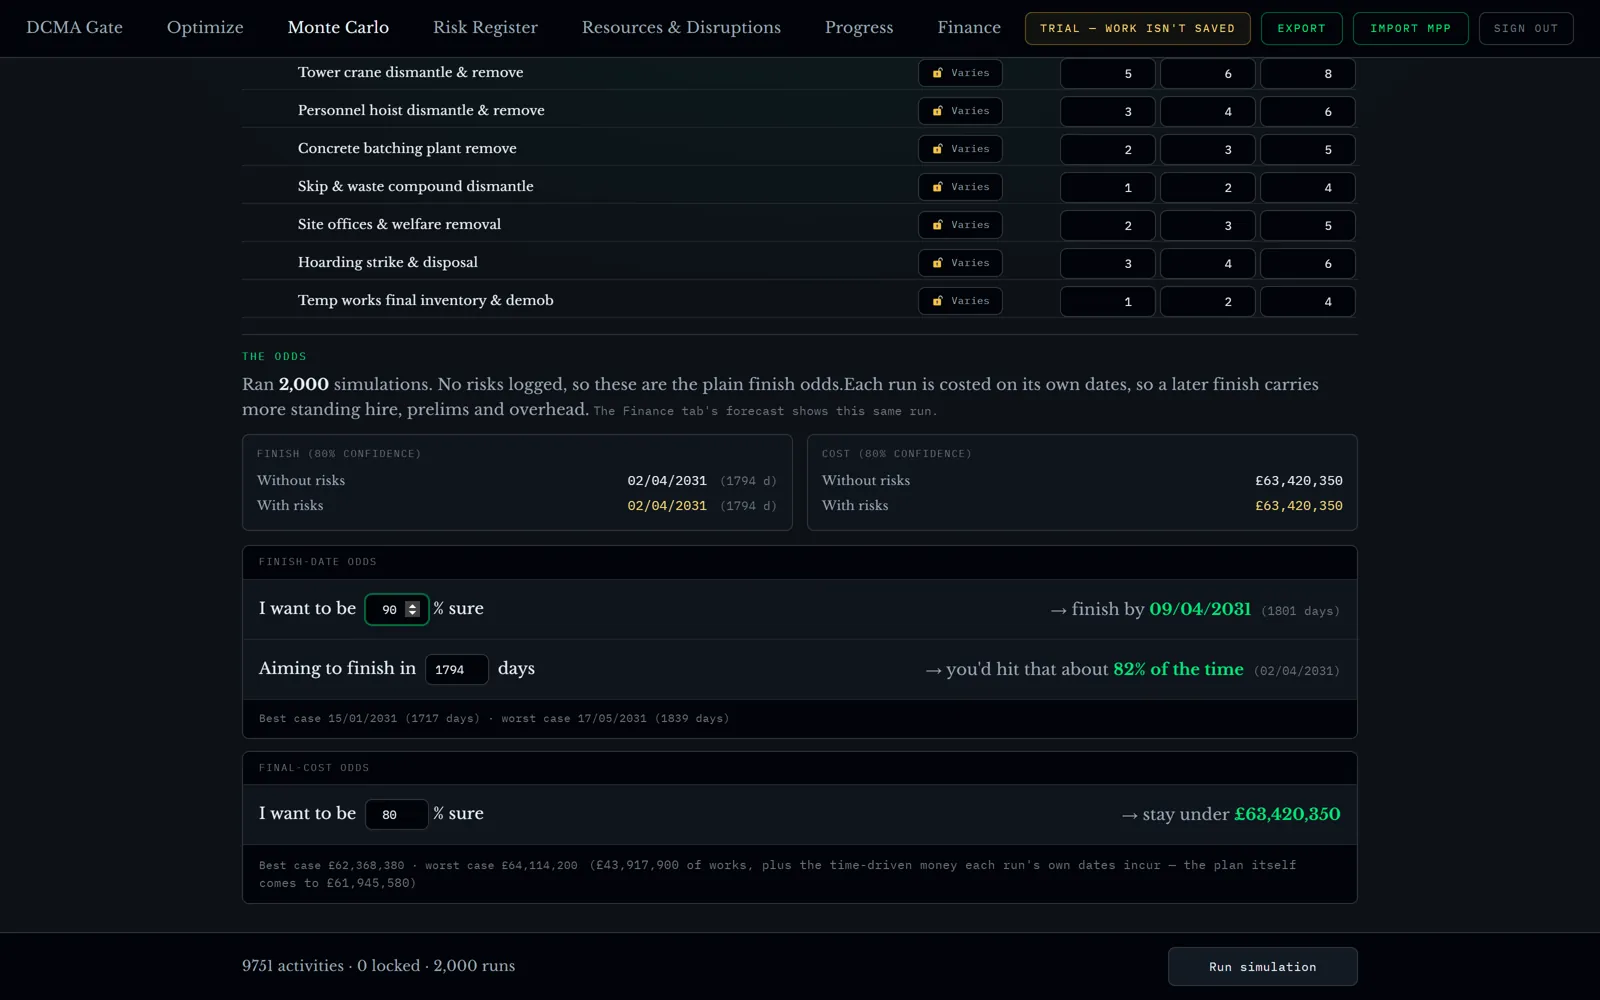
Every task varies within its range and the schedule re-runs 2,000 times. The spread of finish dates and final costs is your real risk. Type a confidence to get a date, or a date to get the odds.
- P10 / P50 / P90 on finish date and final cost
- Lock tasks you are sure about and watch the spread tighten
- Shows the forecast with and without risks, so you see what each risk costs
Every risk, in days and pounds
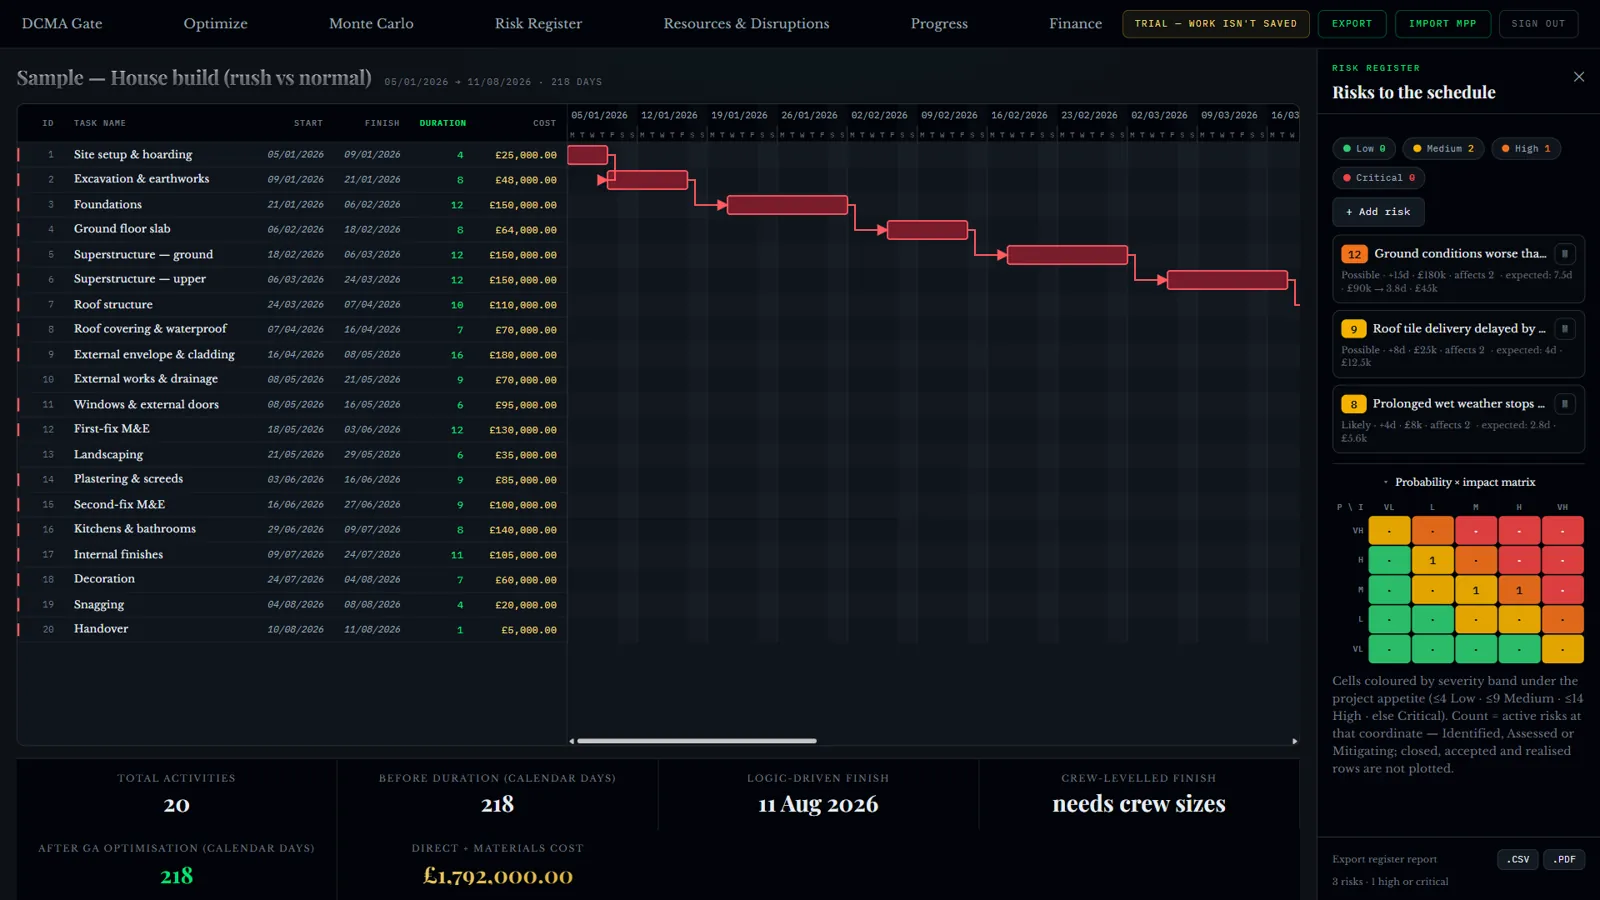
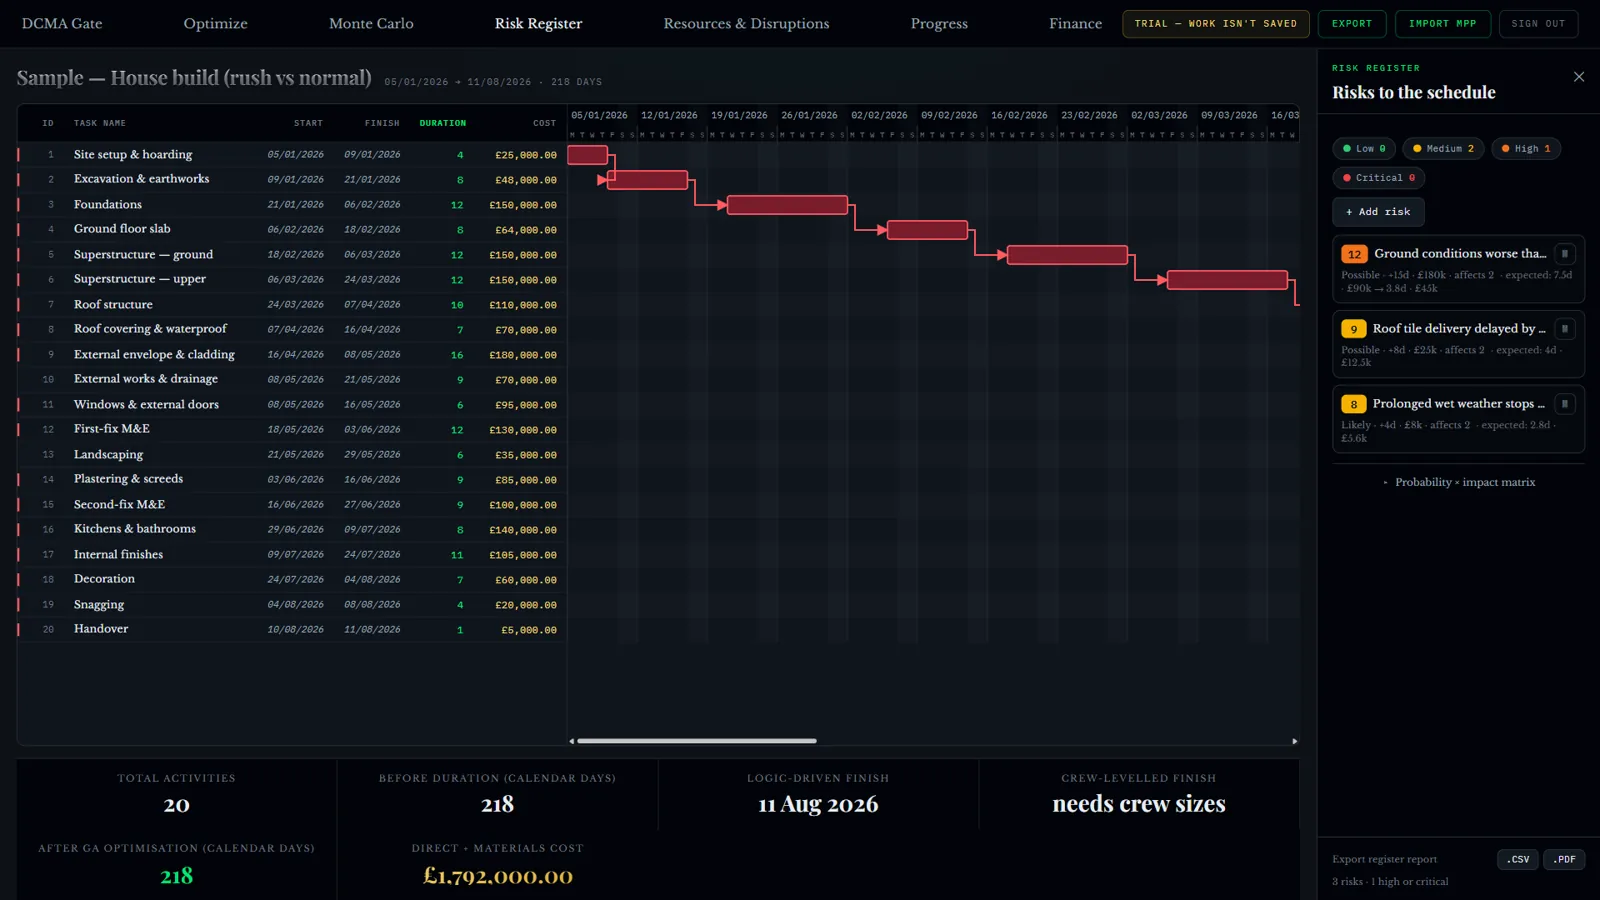
Probability × impact kept in the units the job runs on. Link a risk to the activities it hits by clicking the bars. Only mitigations marked Implemented shrink the forecast. Planned work is tracked and costed but changes nothing.
- 5 × 5 matrix of active risks, ready to present
- Feeds the simulation directly, so the register and the odds always agree
- One click to a CSV or PDF report a QS will read
Percent complete tells you what's done. Not when you'll finish.
Record progress on one card per activity due by the reporting date. Every entry is kept and nothing is overwritten. The tool turns it into a forecast finish and a forecast cost, measured at a day you name.
- Move the date back and every figure is recalculated as it stood then
- Shows the five activities dragging the finish, in days
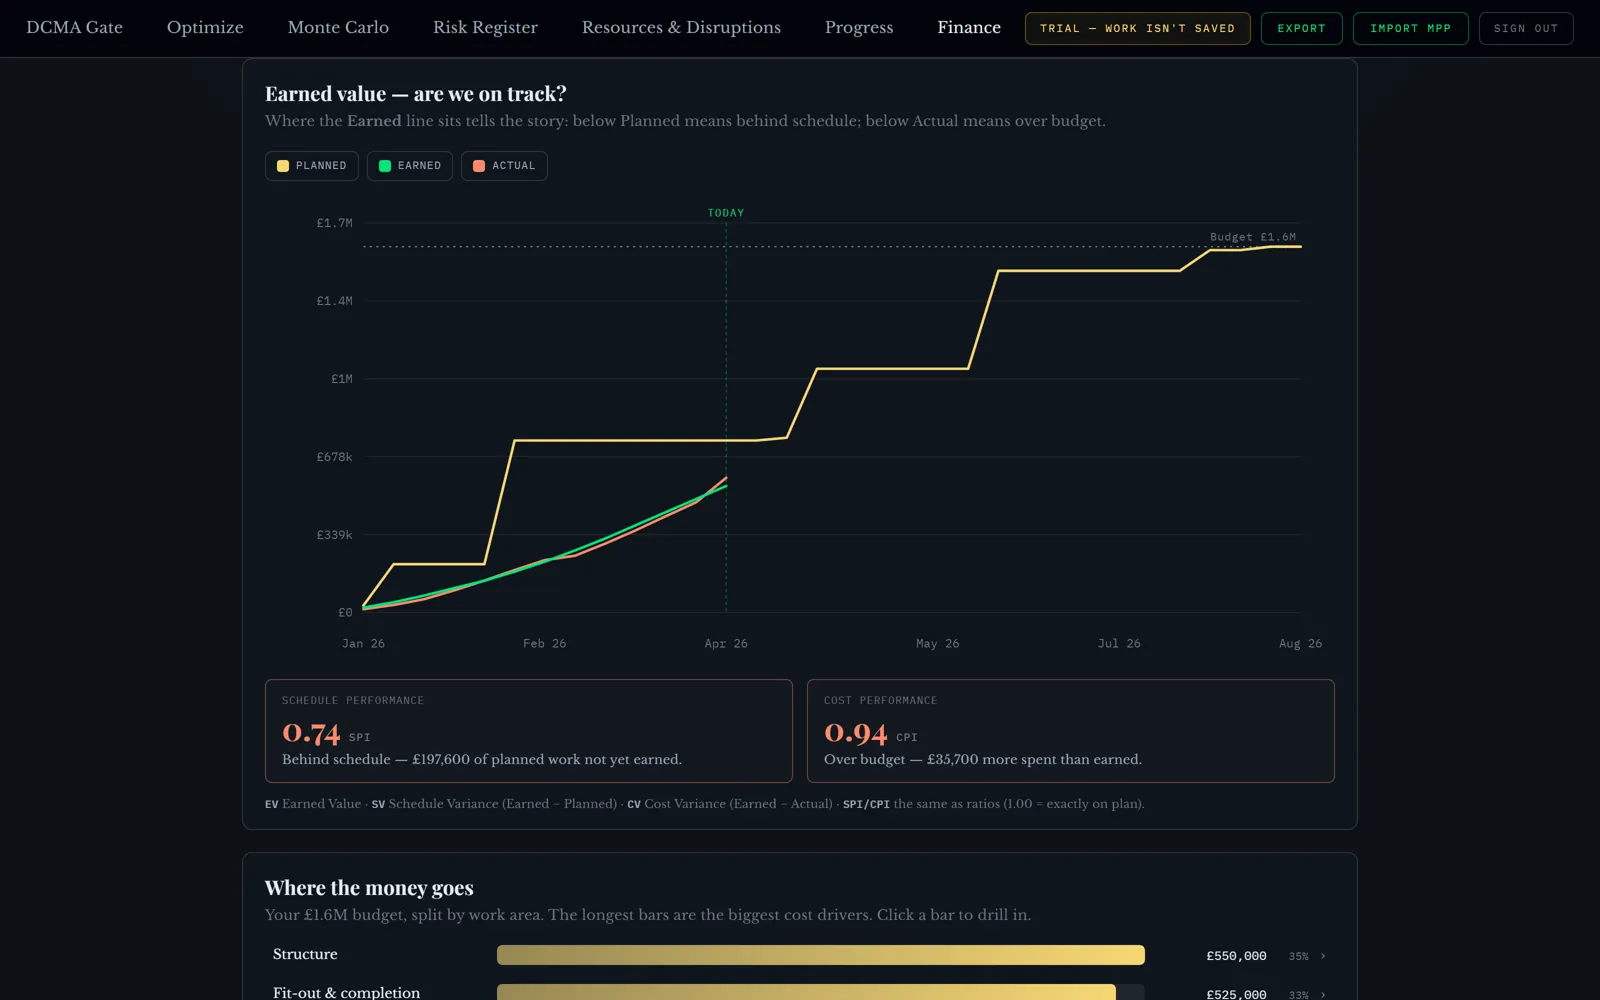
- SPI and CPI written out in pounds, so nobody has to remember which is which
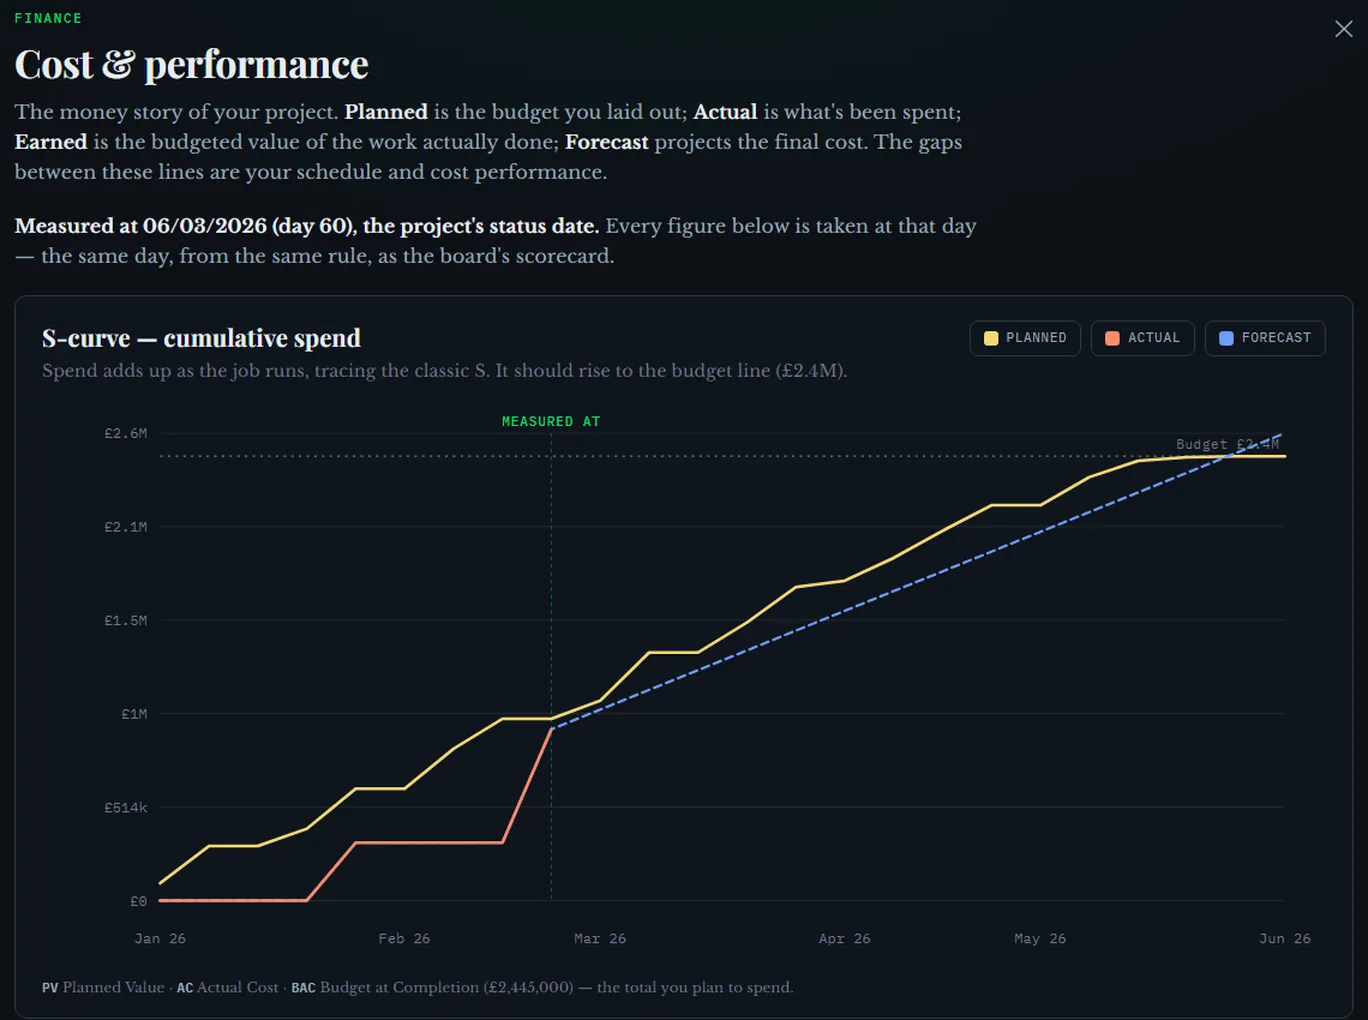
The money view of the whole job
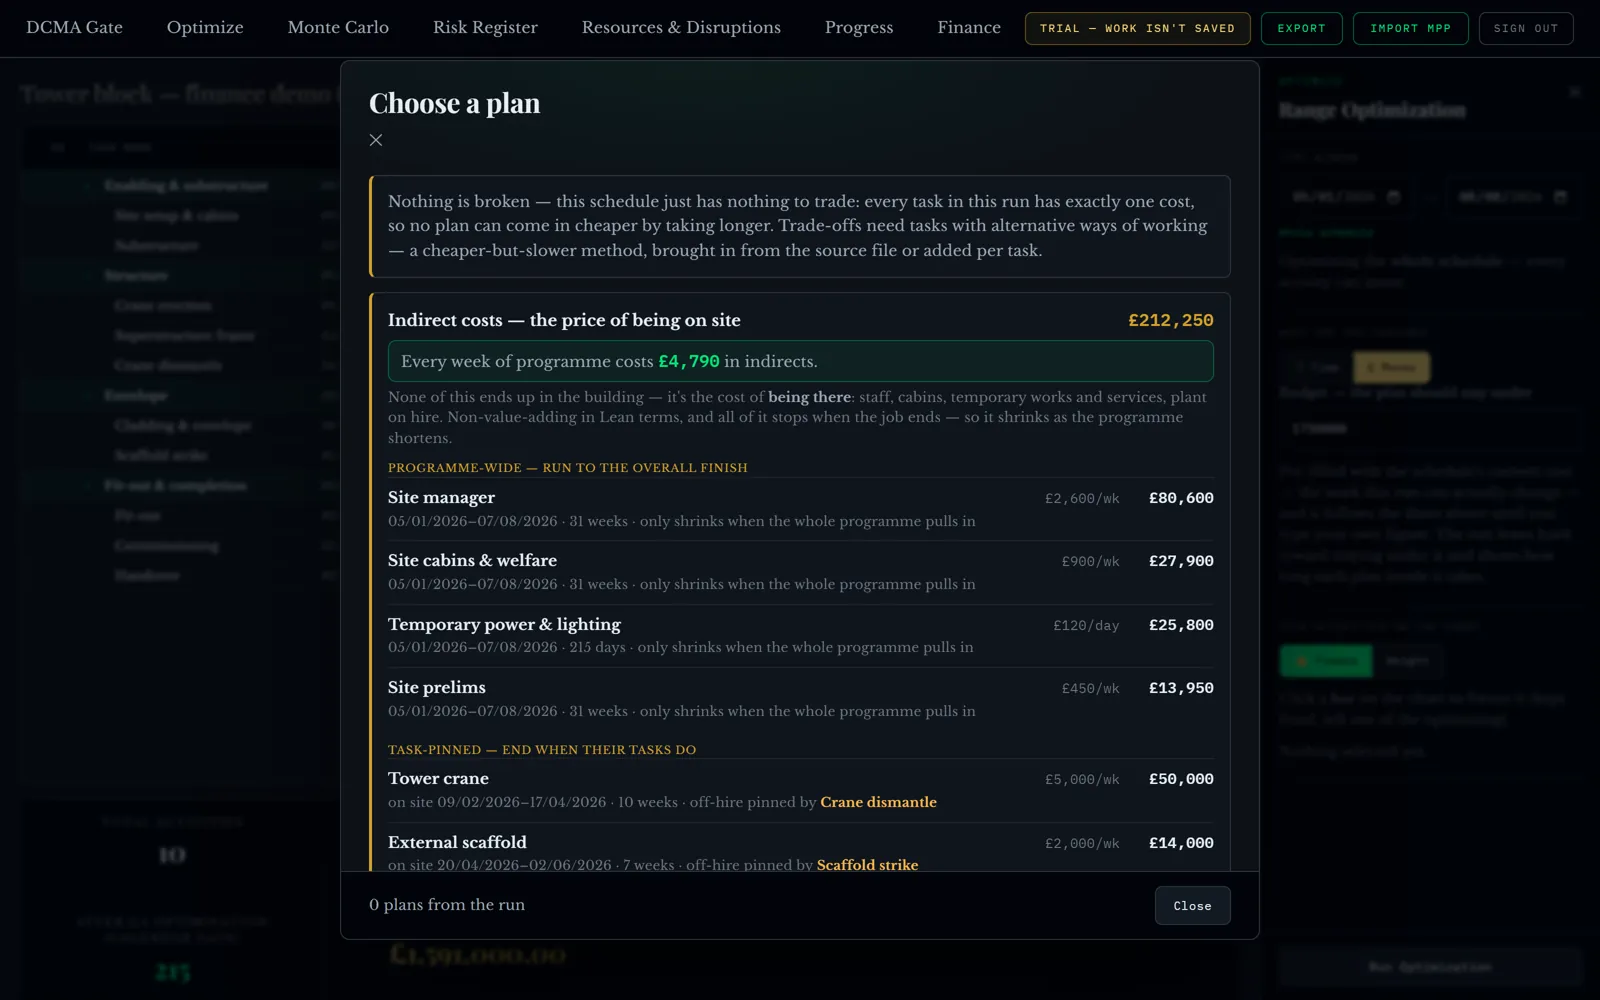
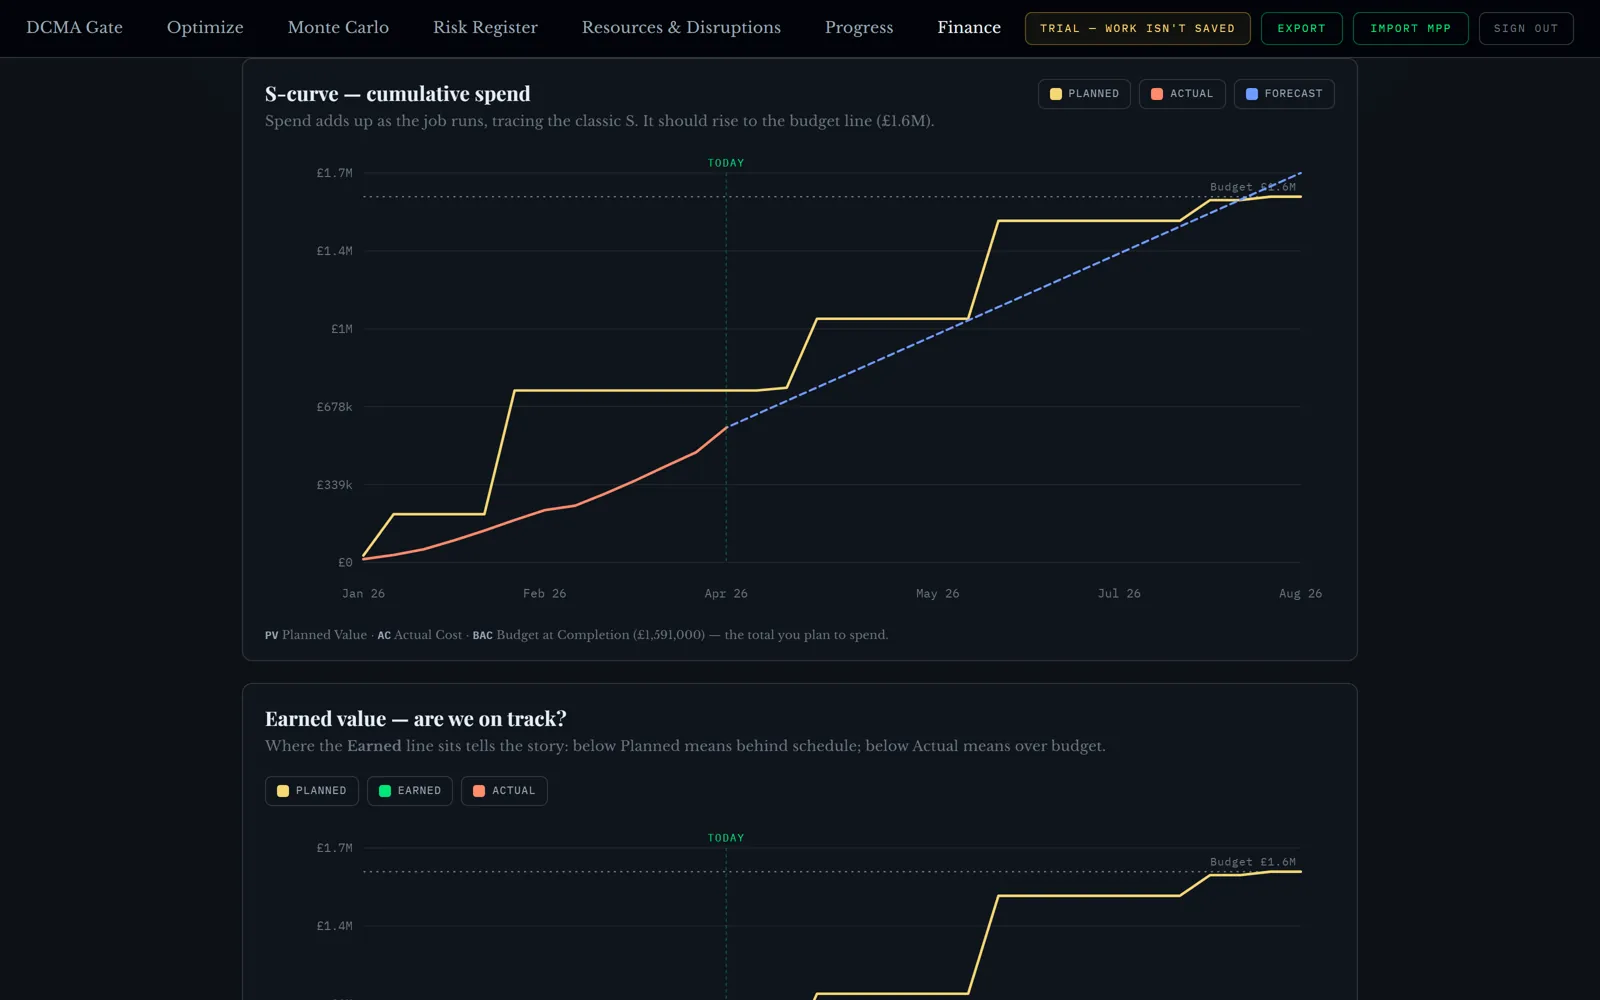
Planned, actual and forecast spend on one S-curve, earned value in plain English, and the cost of being on site mapped week by week, with savings proven by a real schedule re-run.
- Every week of programme priced in indirects: staff, cabins, plant, scaffold
- Savings finder: tick the moves you judge safe, the tool does the maths and logs the risk
- Cost broken down by work area, biggest drivers first
Back out to the tool you plan in
Export the chosen plan as MS Project XML, Primavera XER or PMXML. Risk register and earned-value reports download as CSV and PDF, each stating the day it was measured at. Nothing is saved: your schedule leaves with you.
We do not work twice.
Bring a programme. See what it's hiding. Take the report.