Every programme ends in a single date. One bar, one finish, printed and circulated and written into a contract. And everybody involved knows, quietly, that the date is a best case dressed up as a commitment.
Not because anyone is lying. It is the arithmetic. A critical path takes one duration for each activity and adds them up. But no activity has one duration. Every one of them has a range, and when you chain hundreds of ranges together, the result is not a date — it is a distribution.
Two thousand versions of the same job
So instead of asking "when does the plan say we finish", the tool asks "how might this actually finish". Every activity varies within its likely range, the schedule is rebuilt and re-decoded, and that happens two thousand times.
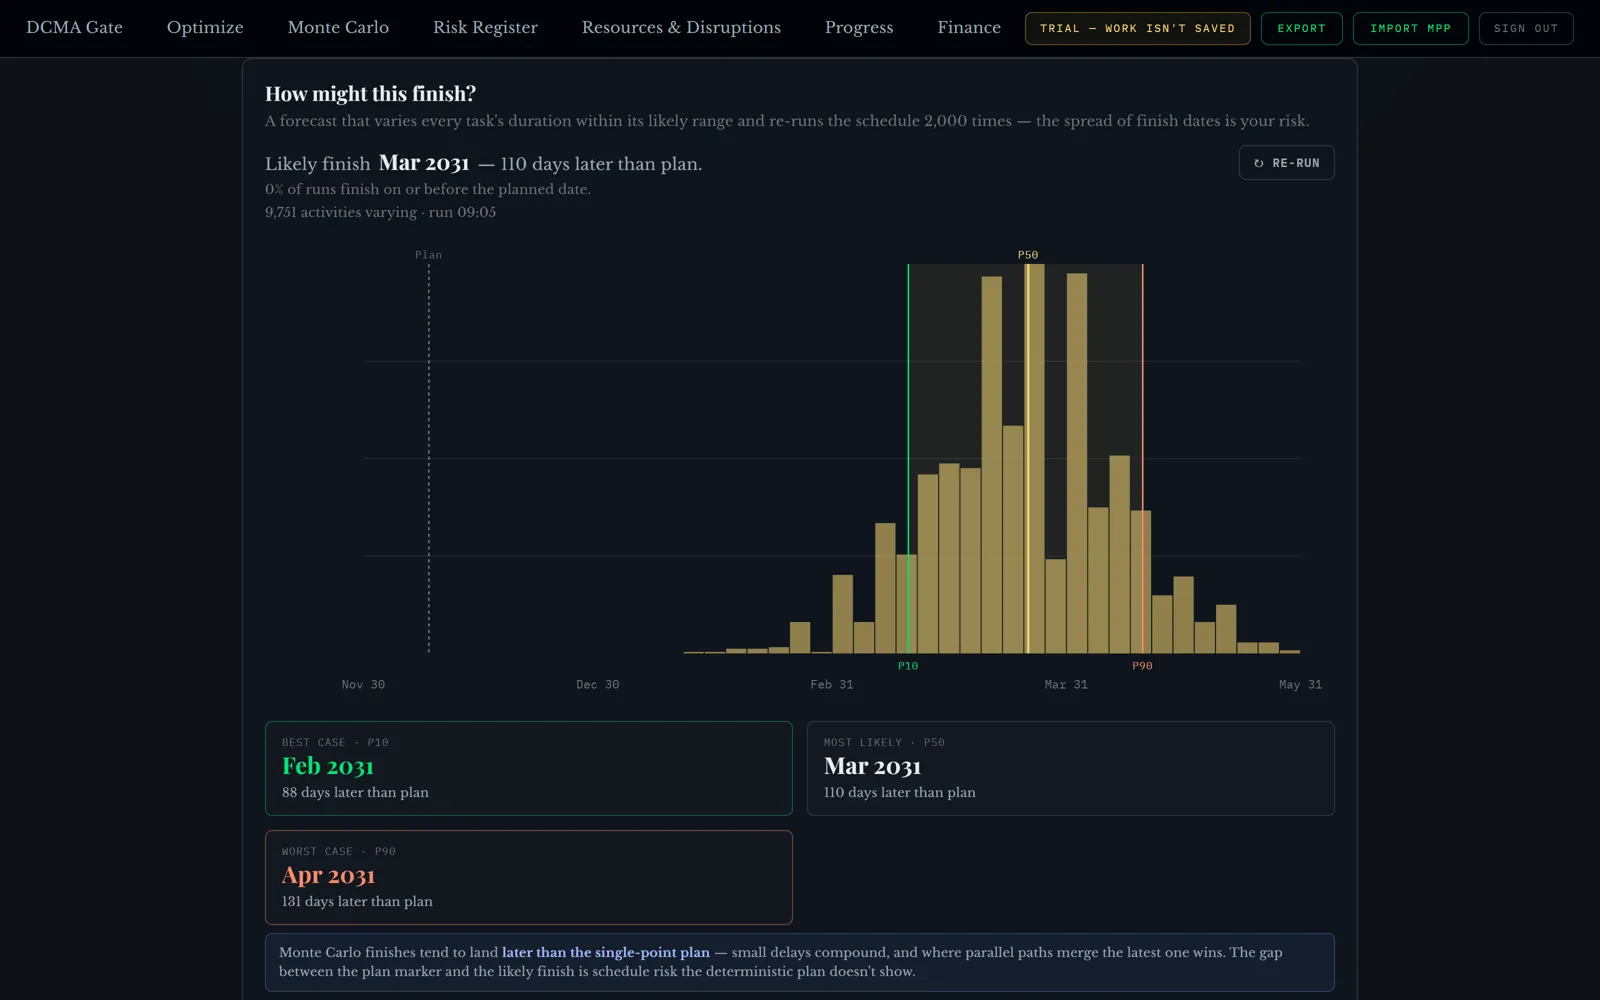
That gap is the whole point. On a healthy programme it is small and you can argue about a fortnight. On a stretched one, the plan's date sits out on the left-hand tail where almost none of the two thousand runs land, and no amount of confidence in the meeting changes that.
It is worth being clear about why simulated finishes usually land later than the plan. Delays compound and the latest path always wins: an activity that runs short only helps if everything feeding into the same point also runs short, while a single overrun anywhere on the critical chain pushes the finish. That asymmetry is real, and a forecast that hides it is flattering you.
Risks that are actually priced
Most risk registers grade things High, Medium or Low and get filed after the tender. That tells you nothing you can act on. The two questions anyone actually asks are: how many days, and how much money.
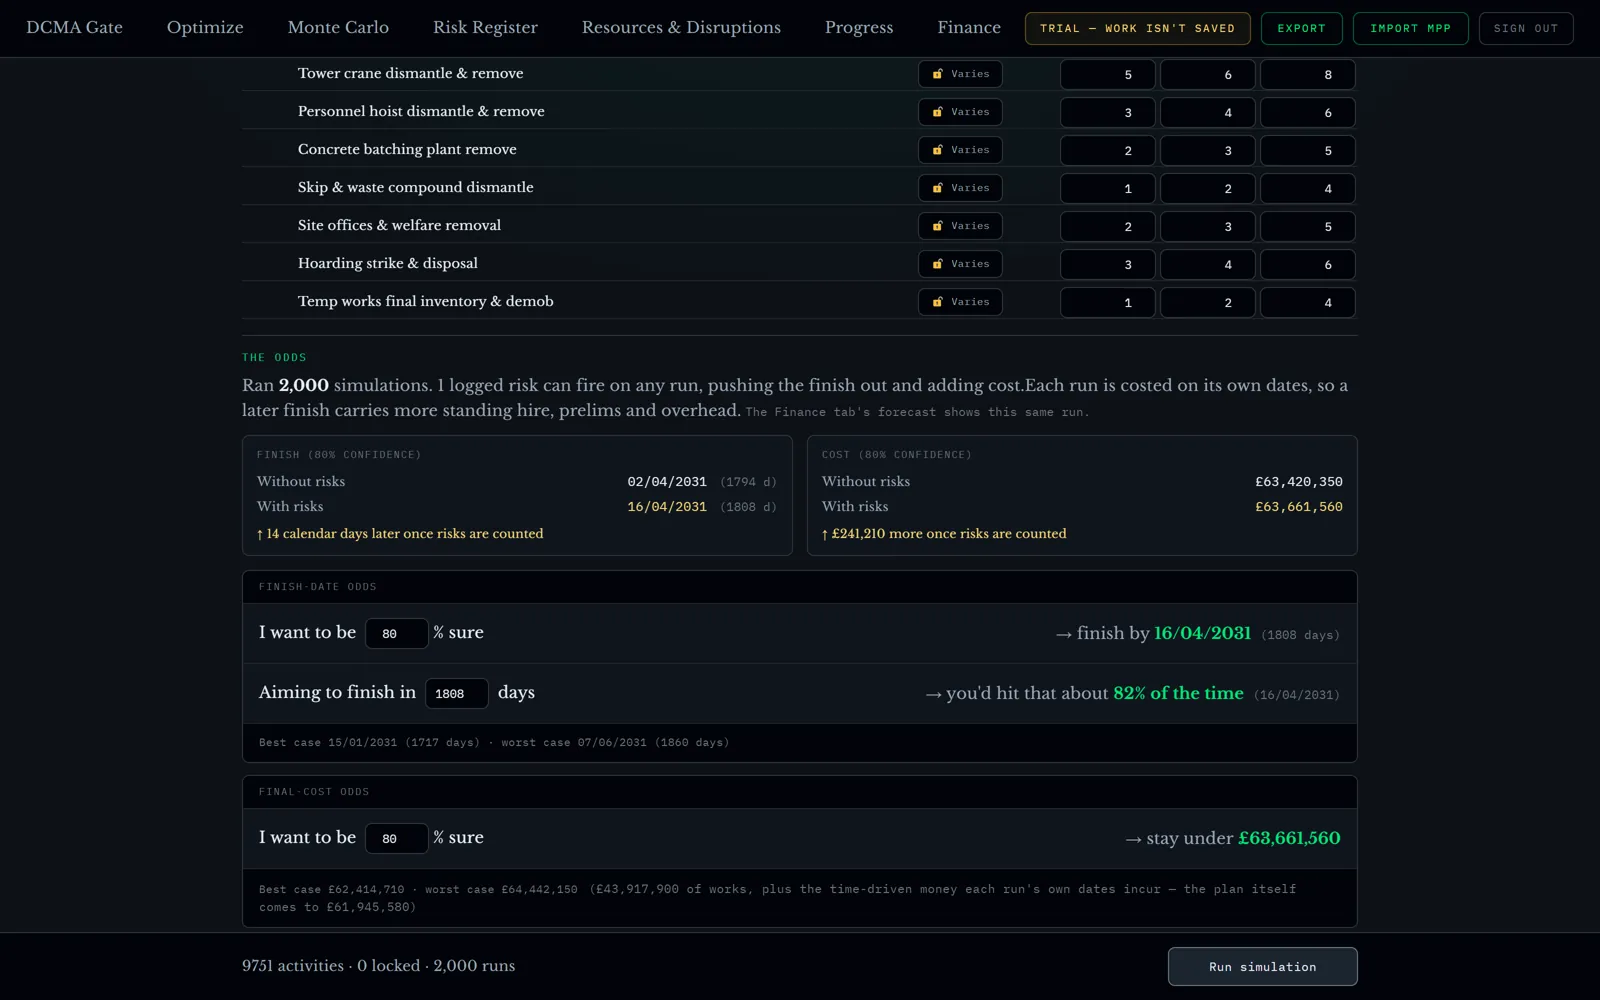
Then it goes into the same simulation. On the runs where the risk fires, it bites; on the runs where it does not, nothing happens. Which is exactly how risk behaves on site, and nothing like the flat contingency percentage most programmes carry.
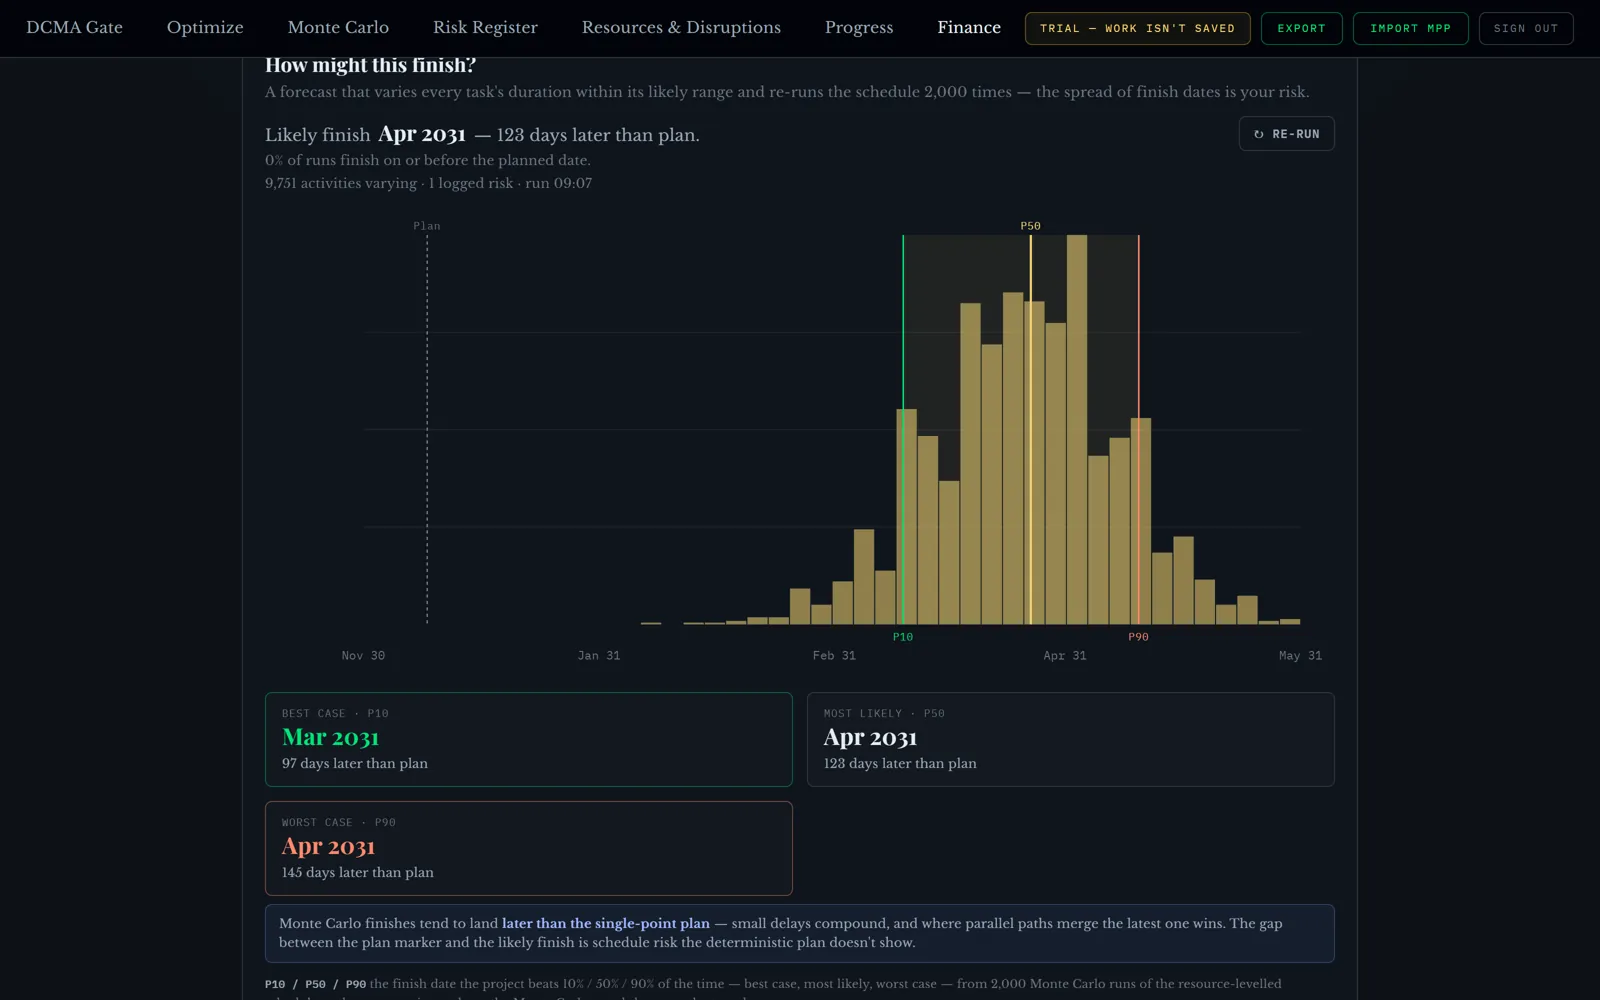
That comparison is the useful bit. "This risk is worth eight days and £723,490 to us" is a sentence you can take to a client, an insurer or a board. "Ground conditions: amber" is not.
Turn a target into a probability
Clients do not ask for distributions. They ask whether you will be finished by the date in the contract. The honest answer is a percentage, and the tool works it both ways round: type a confidence and get the date, or type a date and get the odds. The same works on cost — to be 80% sure, stay under this figure.
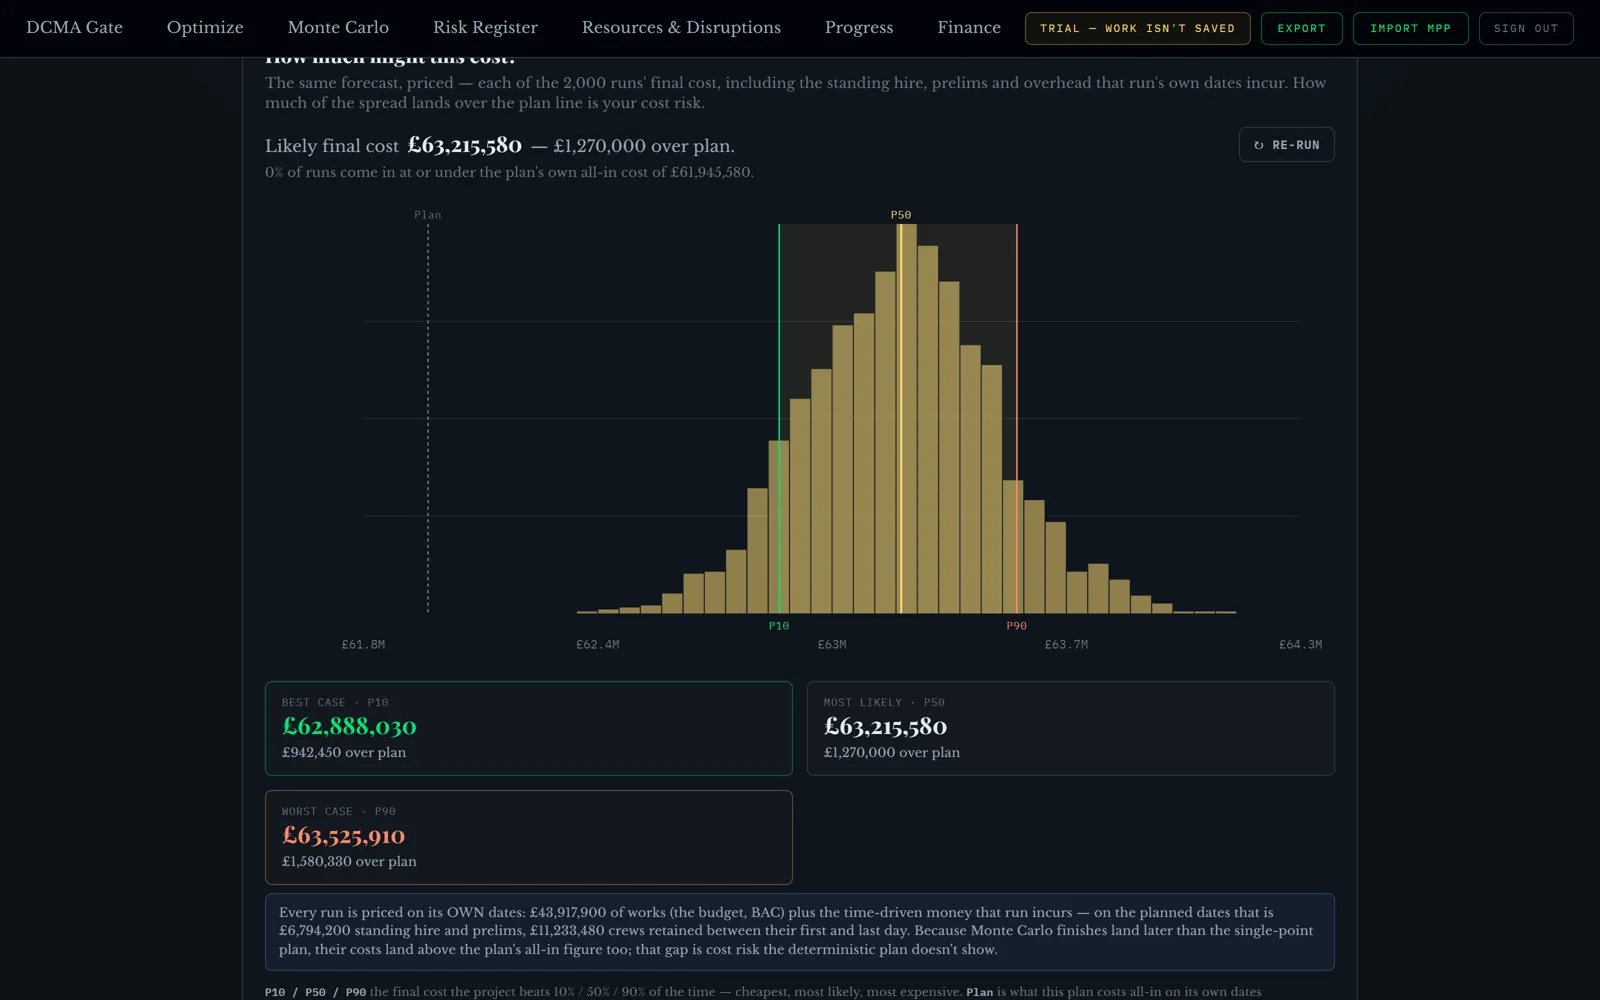
Pricing the runs rather than the plan is what makes the cost side honest. A programme that finishes eleven weeks late does not just cost late-completion damages; it costs eleven more weeks of being on site. Those two numbers come from the same simulation, so the time story and the money story cannot disagree.
Not everything is uncertain
A forecast that treats every activity as a guess is its own kind of dishonesty. Some things are fixed: a contracted milestone, a committed delivery, a possession date you have already booked.
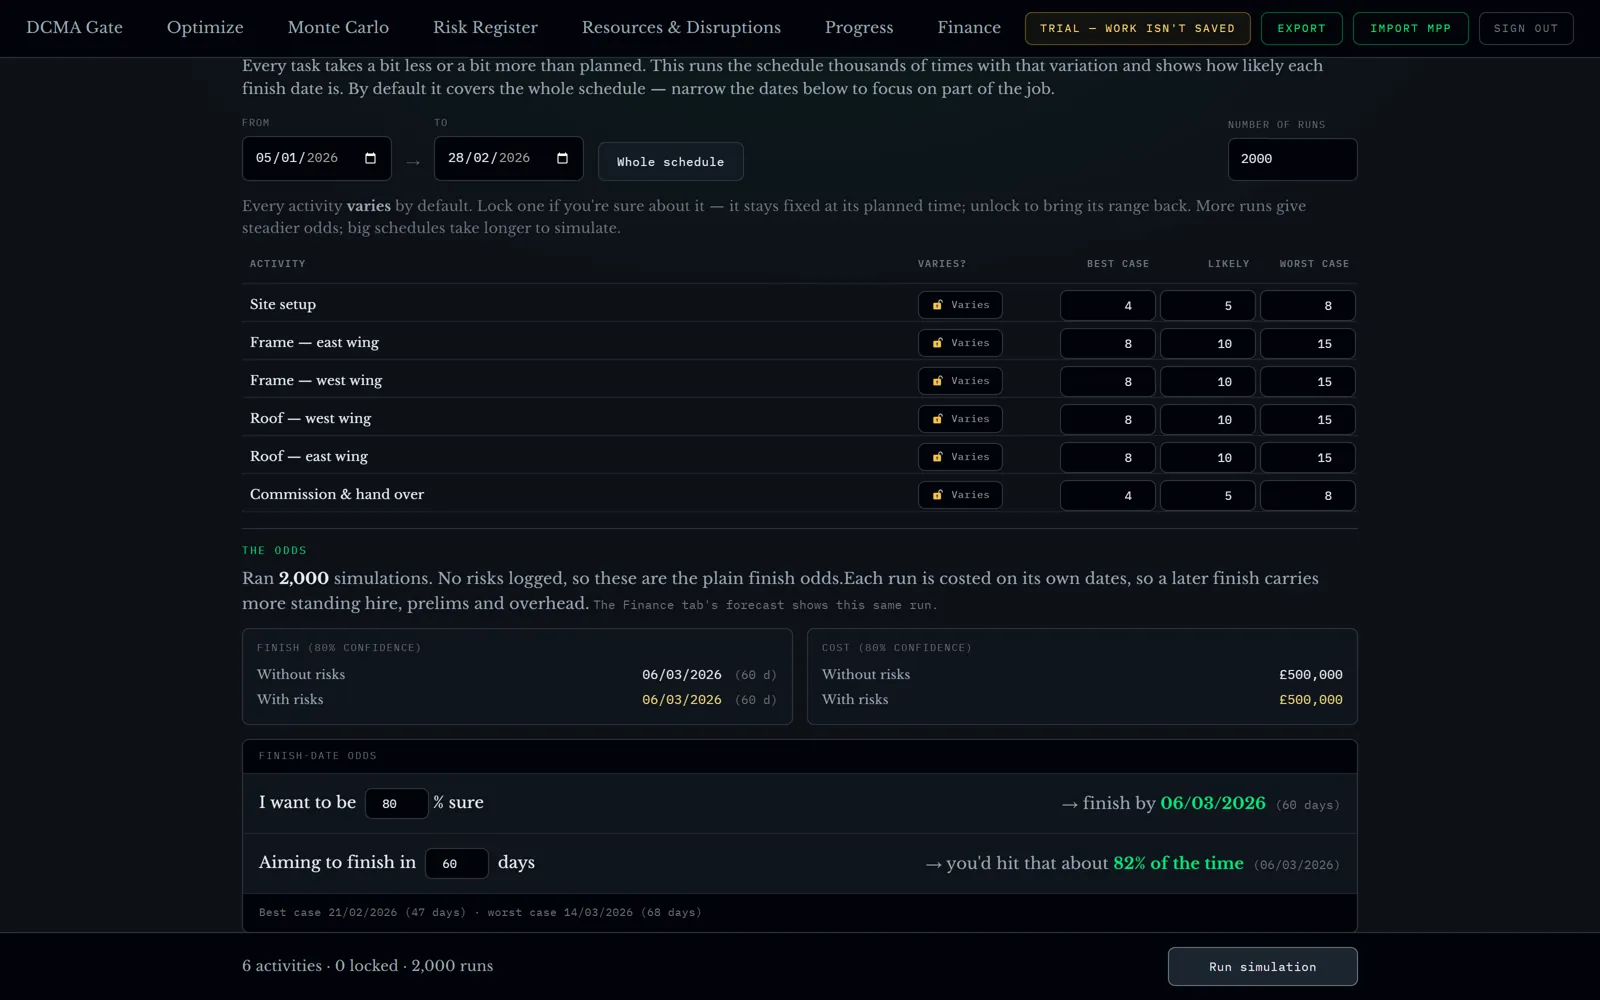
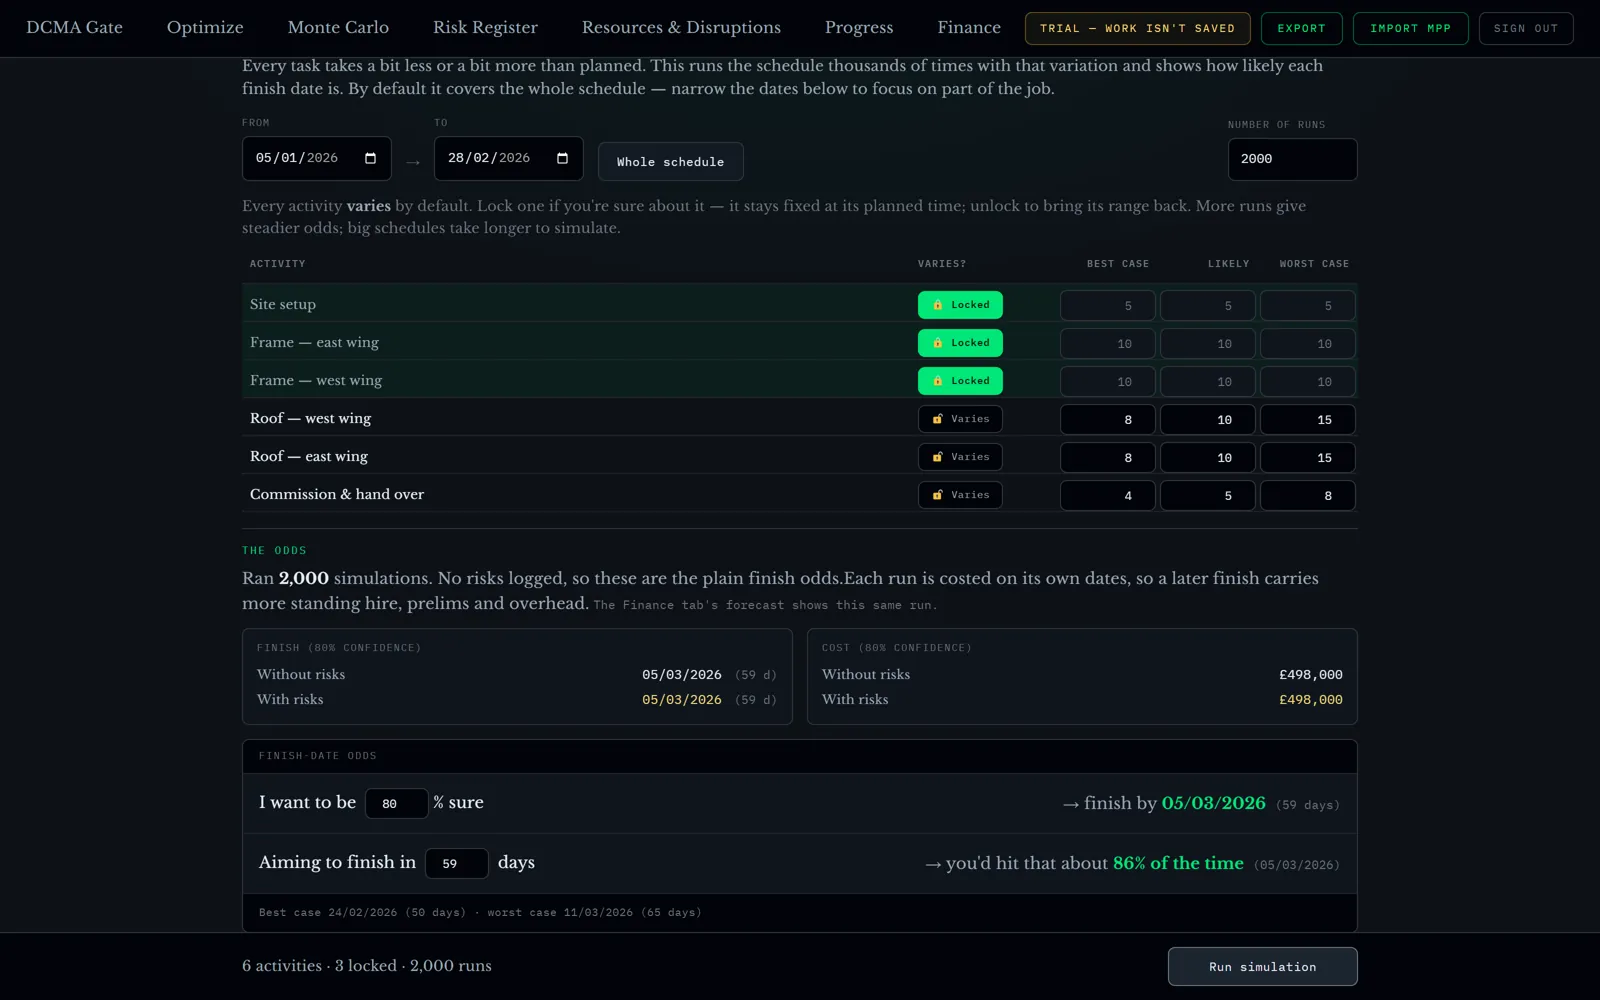
I like this part because it turns the forecast into a conversation rather than a verdict. Lock what you know, watch the odds sharpen, and you can see exactly which unknowns are costing you the most breadth. Usually it is two or three activities, and they are rarely the ones people worry about.
What it is not
Monte Carlo does not predict the future. It tells you what your own assumptions imply, which is a different and more useful thing. Feed it optimistic ranges and you will get an optimistic distribution, prettier and just as wrong.
It also cannot see a risk you have not logged. The simulation is honest about the register it was given: it reports how many risks fired, how many were excluded because they were closed, and how many are active but linked to no activity, so nobody mistakes a thin register for a safe job.
Run it on your own programme
GeneraGantt reads MS Project, Primavera P6 and Asta Powerproject, and the risk and forecast reports download as CSV and PDF, each stating the day they were measured at. Nothing is saved: your schedule leaves with you.
It is free while it is in testing, with a sample programme loaded, so you can run the simulation without uploading anything of your own.
Figures in this article come from the sample programmes in GeneraGantt.