A programme turns up as an email attachment. Somebody opens it, looks at the bars, and it becomes the plan of record — the thing progress is measured against, delay is argued over, and money is claimed on.
Almost nobody checks it first. Not because planners are careless, but because checking it properly by hand takes a day, and the meeting is on Thursday.
Fourteen questions, asked before anything else
The DCMA 14-point assessment came out of the US Defense Contract Management Agency and has become the common yardstick for schedule quality across defence, infrastructure and major construction. It is not a British standard and it is not perfect, but it asks the right fourteen questions, and most people in the industry recognise it.
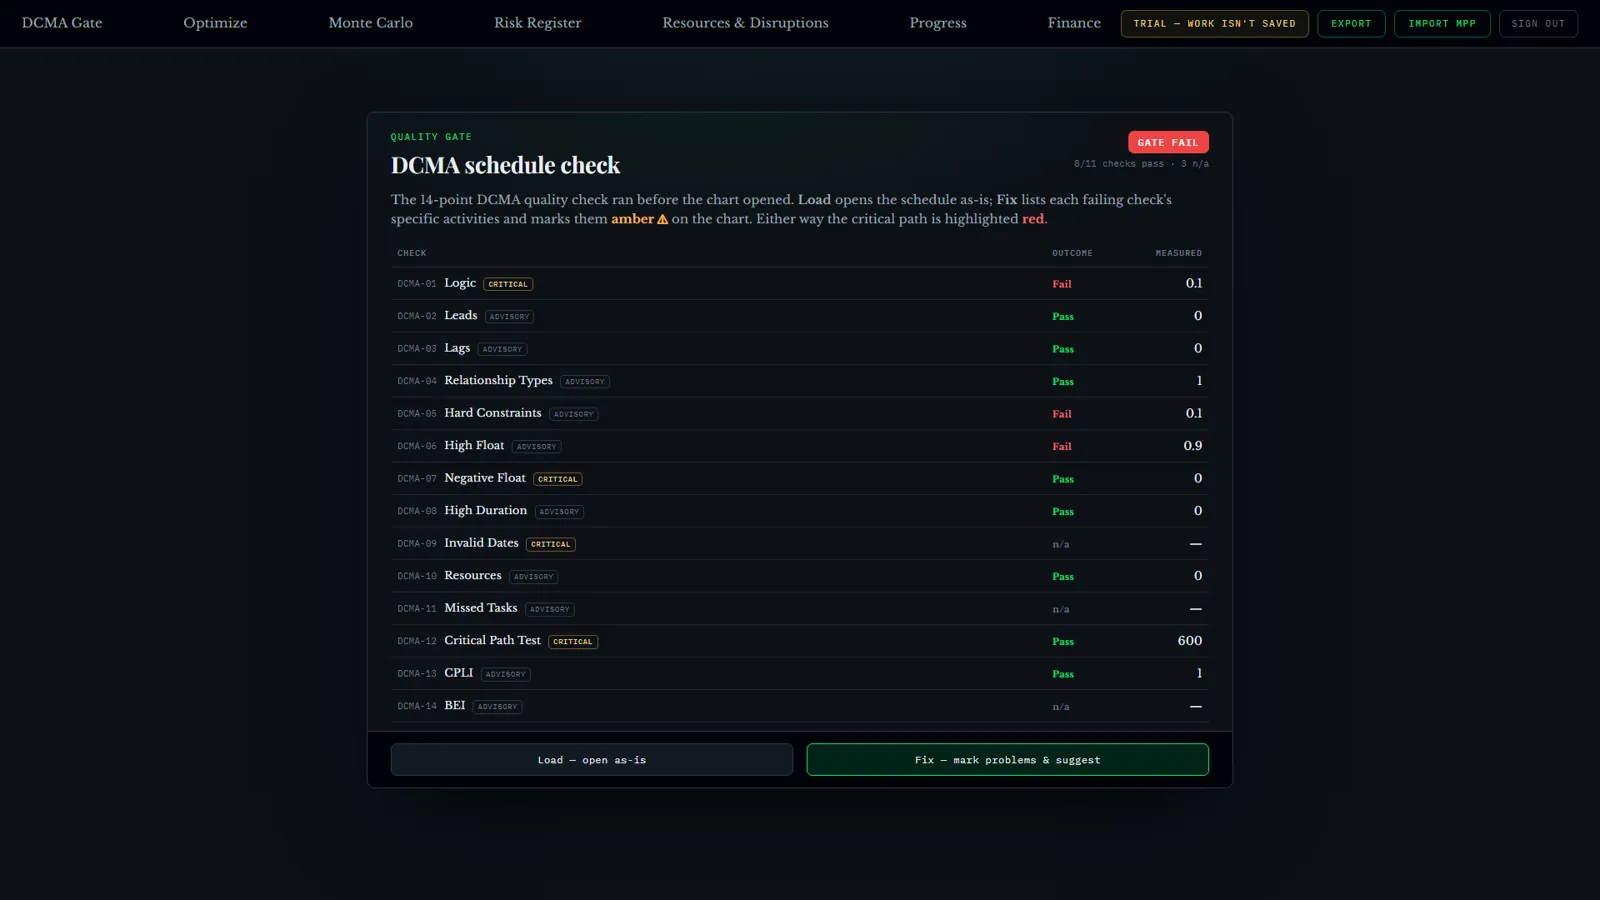
In GeneraGantt the check runs the moment a file is imported, before the chart opens at all. You get a result, not a chart with a problem hiding in it.
Four of the fourteen are different from the rest
Not all failures are equal, and treating them as a flat list of amber warnings is how people learn to ignore them.
Four checks are treated as critical, because when they fail the schedule's own arithmetic cannot be trusted. The other ten are advisory: they make a programme worse to work with without making its dates meaningless.
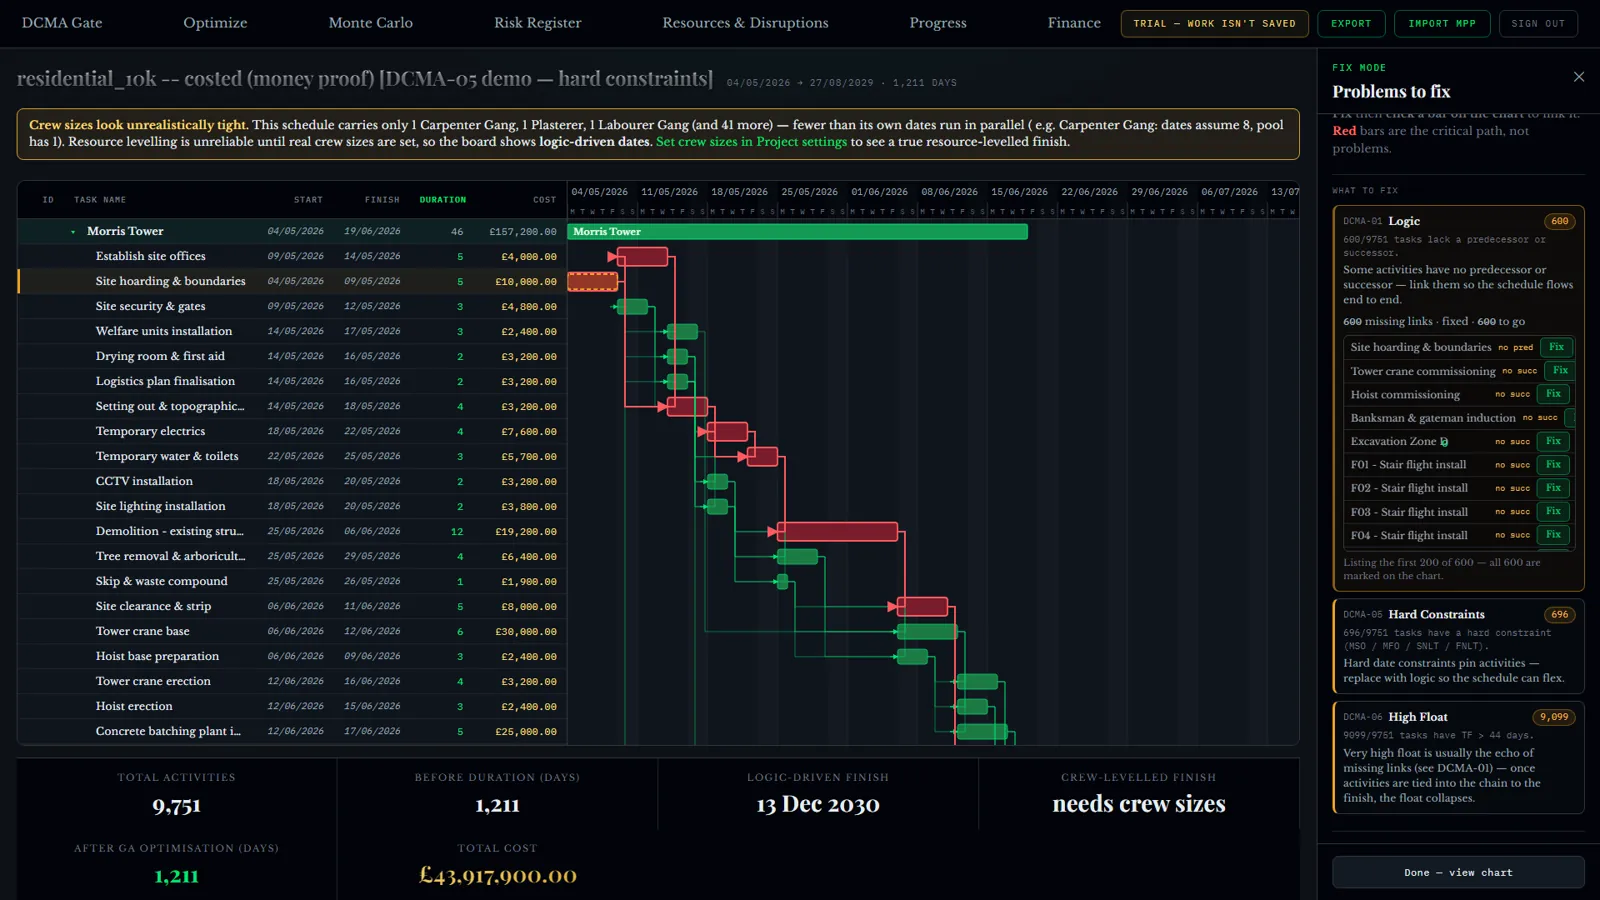
The two that matter most on real construction files are these.
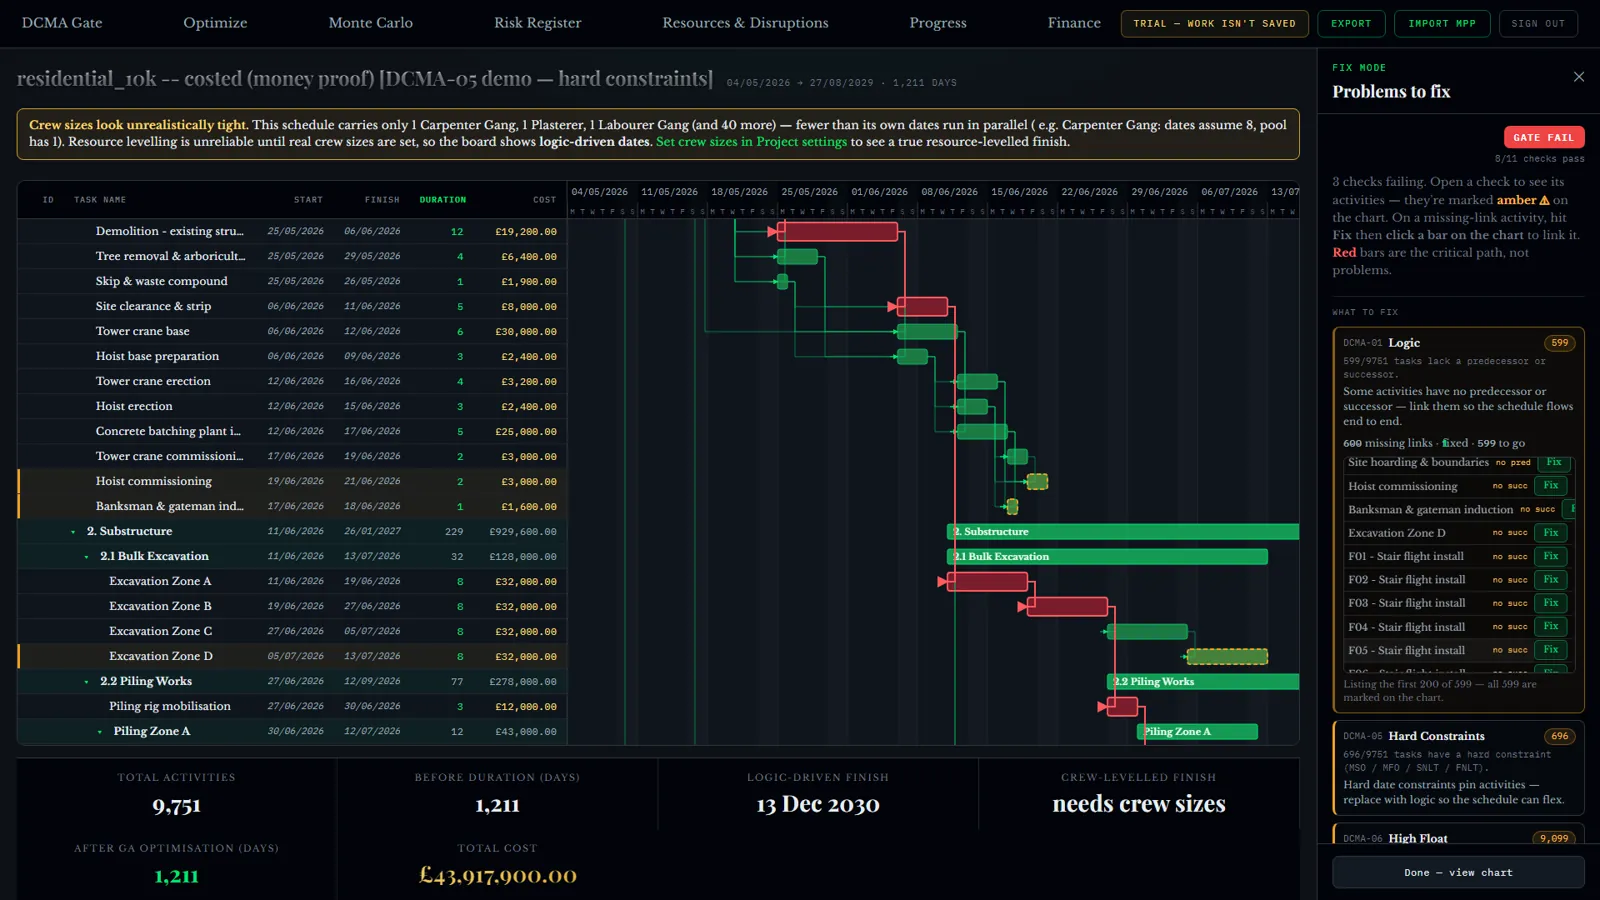
Logic. An activity with no predecessor and no successor is floating free. It has no float, it can never be critical, and nothing that happens around it moves it. Six per cent of activities unlinked sounds small until you realise that on a 9,751-activity programme it is around 600 activities that the critical path simply cannot see.
High float. When most of a programme has enormous float, it usually means the logic is thin rather than the job being relaxed. A programme where 93% of activities have huge float is telling you that the network is barely connected, whatever the dates say.
The other twelve — leads, lags, relationship types, hard constraints, negative float, high duration, invalid dates, resources, missed tasks, critical path test, critical path length index, baseline execution index — are all worth knowing. But those first two are where programmes usually fail, and they are the ones that make everything downstream unreliable.
Your thresholds, not somebody else's
A standard you cannot tune is a standard people learn to ignore. "High float" means one thing on a two-year civils job and something else entirely on a nine-week fit-out.
So every threshold is editable per project and the check re-evaluates as you type. Five of them are fixed, because the standard itself fixes them. Each row's verdict comes from the same engine that produces the badge, so the table and the headline can never disagree — which sounds obvious until you have used a tool where they do.
A failure that points at real activities
This is where most quality reports stop being useful. "Your schedule has problems somewhere" is not an action.
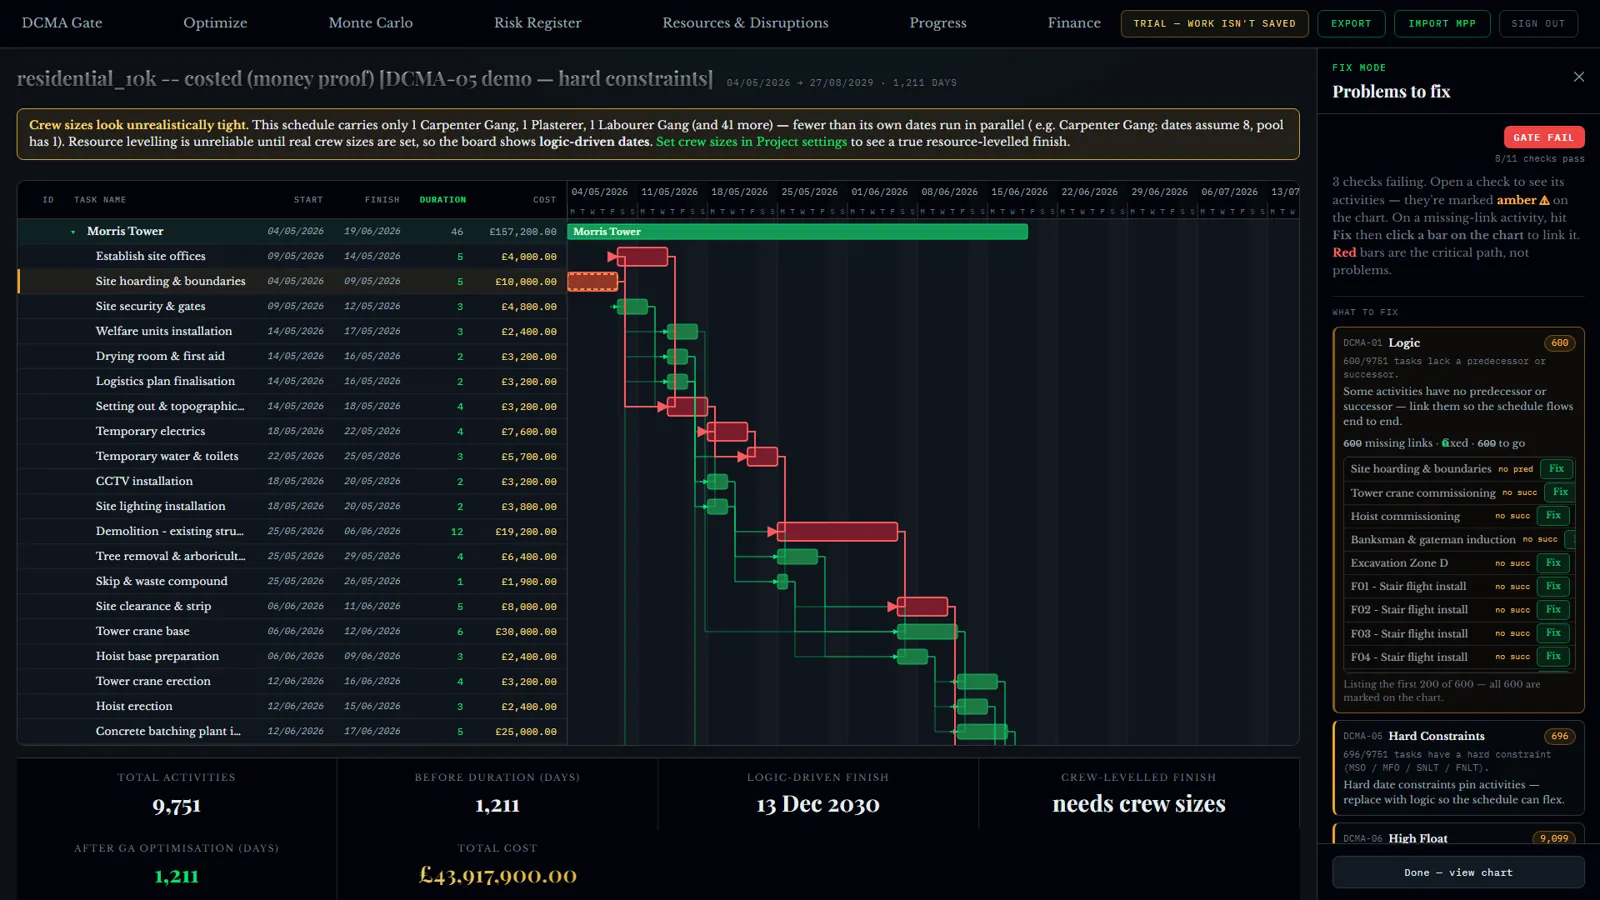
The critical path stays red and separate, so "critical" never gets confused with "has a problem". You are not hunting through thousands of rows; the tool takes you to what is wrong.
Fix it here, not in a round trip
The part I am most pleased with is that you repair the schedule in the same place you found the fault. To add a missing link you click the bar you want to connect to — the way a planner actually thinks about a dependency, visually, on the timeline — rather than typing activity IDs into a dialog.
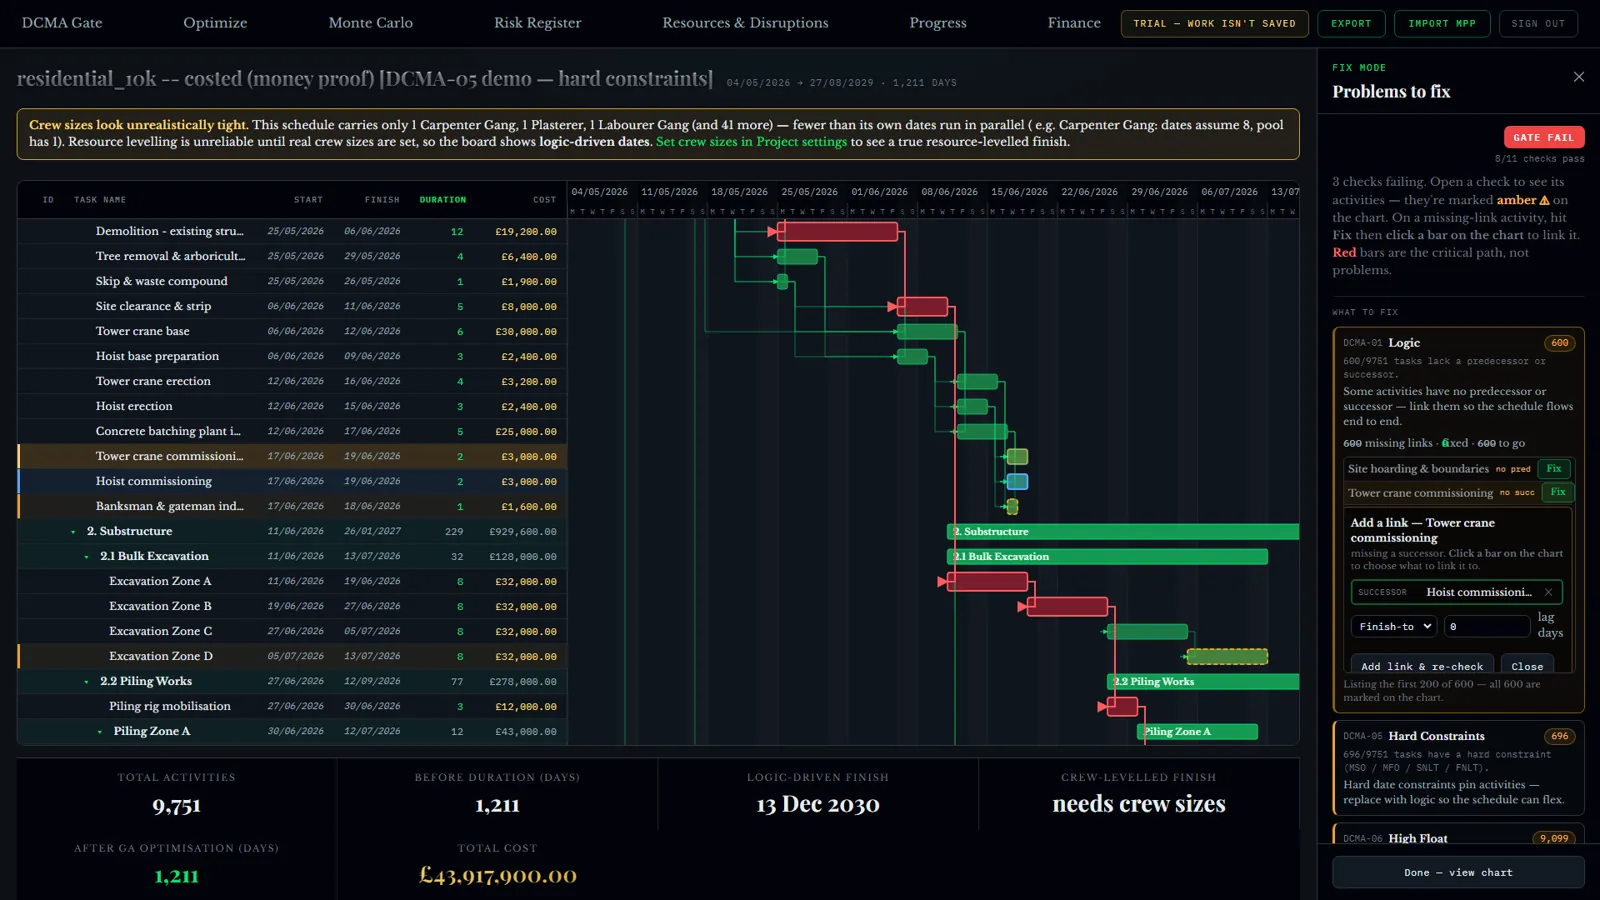
Each fix re-runs the check instantly. The failing count ticks down, the activity clears from the list, and you can watch the programme get healthier rather than waiting for a re-run at the end.
And where the data is too thin, it says so
Honesty matters more here than anywhere else in the tool, because a quality check that quietly invents numbers is worse than no check at all.
Where crew data is too thin to trust — one carpenter gang in a file whose dates assume eight — it shows logic-driven dates and tells you what to set, instead of producing a resource-levelled programme that the data cannot support. That warning sits on the screen rather than in a footnote.
Why bother, if the programme is already agreed?
Because everything you do afterwards rests on it. A forecast built on a network with 600 floating activities is a forecast of something that is not the job. An optimiser cannot improve logic it cannot see. An earned value report measured against a programme that fails its own arithmetic will be argued away the moment it becomes inconvenient.
And in a dispute, "we checked it against DCMA on the day it was issued, and here is the report" is a considerably stronger position than "it looked fine".
Run it on your own programme
GeneraGantt reads MS Project, Primavera P6 and Asta Powerproject. Drag the file in and the check runs before the chart opens, with nothing to configure first. Nothing is saved: the schedule lives for your session and leaves with you.
It is free while it is in testing, and a sample programme is loaded if you would rather look before you upload anything.
Figures in this article are measured on a live 9,751-activity programme worth £43.9M, and on the sample programmes in GeneraGantt.