A job rarely announces that it has started losing money. There is no month where the cost report comes back red and everybody agrees something has gone wrong. What happens instead is that three or four reports in a row each look very slightly worse than the one before, and every single one of them is defensible on its own.
So we built that and measured it. A full waste water treatment works upgrade — inlet, two storm tanks, three primary settlement tanks, four aeration lanes, four final settlement tanks, sludge, tertiary, the MCC and instrumentation package, the mechanical plant. 260 activities, £41,751,000, twenty-five months, every activity priced and five trades on hourly rates.
Then we recorded progress three times, roughly two and a half months apart, the way a commercial manager actually would: per cent complete and cost to date against each activity that had started.
May: on plan
Eleven activities had started. Site establishment, the haul roads, the over-pumping, the first excavations, the inlet chamber piling. £2.1M spent against £2.95M of work planned to be under way.
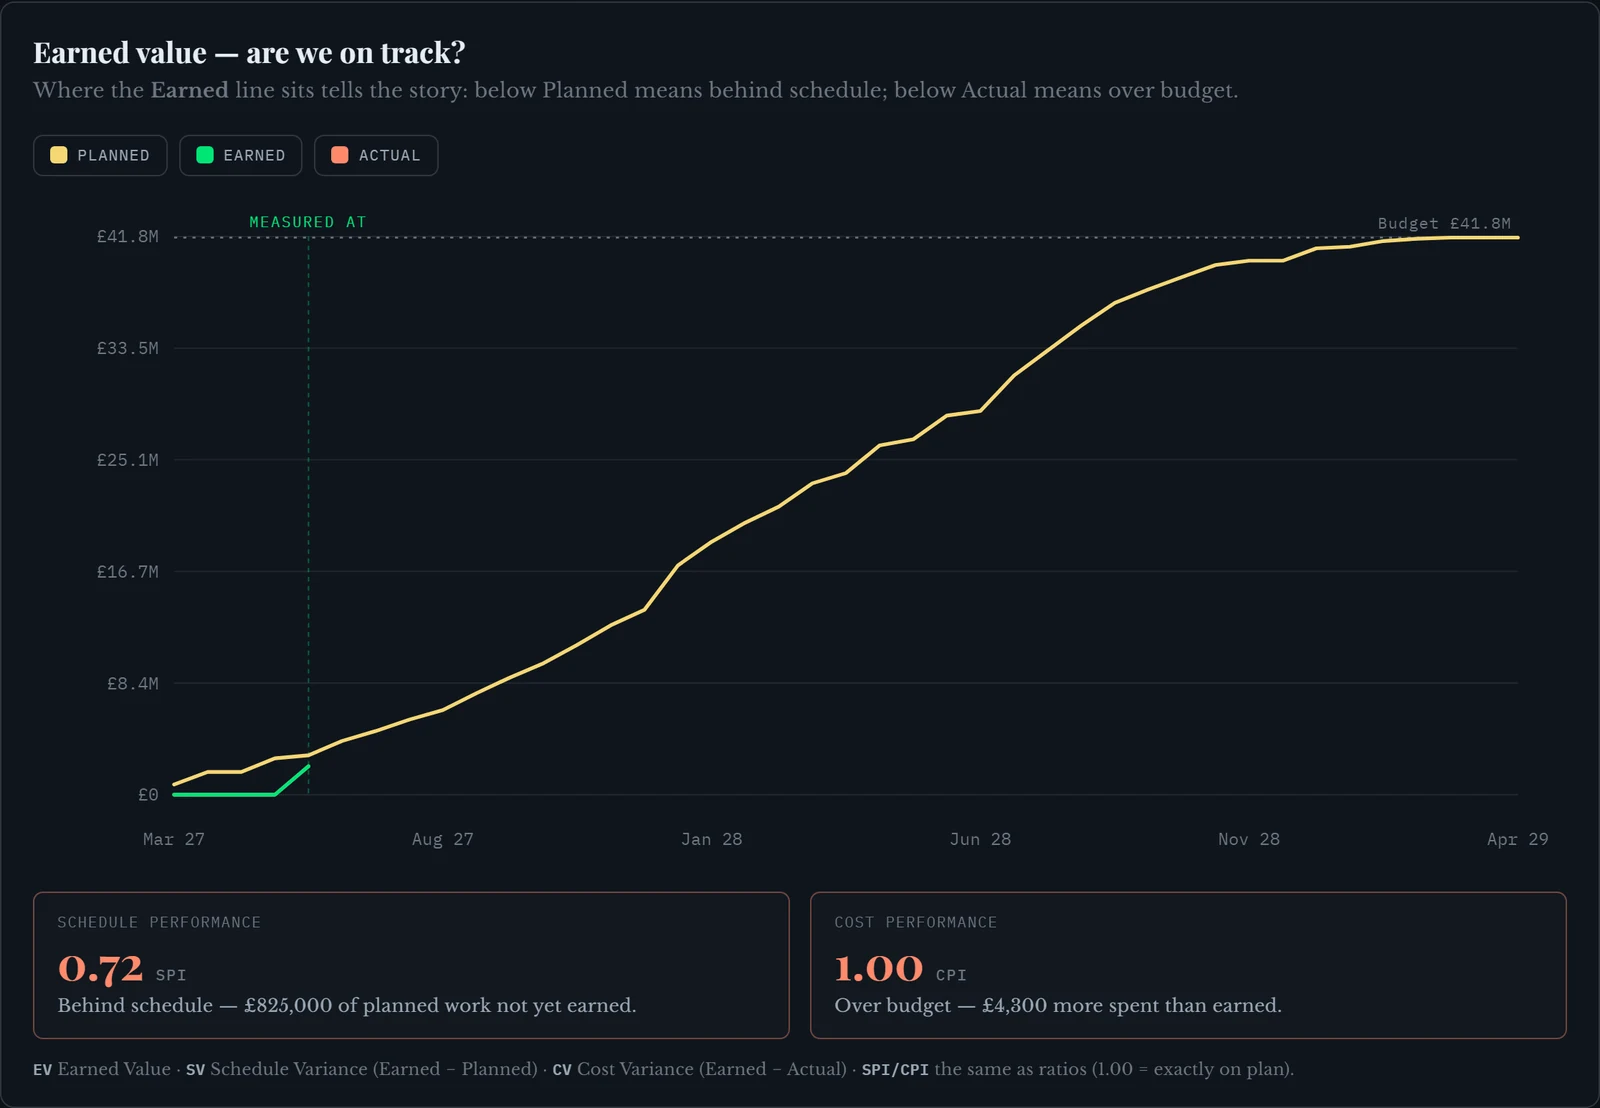
Which is the correct reading. Nothing was wrong in May. The civils were running to programme, the gangs were where they should be, and the money out matched the work done almost exactly.
October: £629,850 more spent than earned
Five months later, the same screen on the same job.
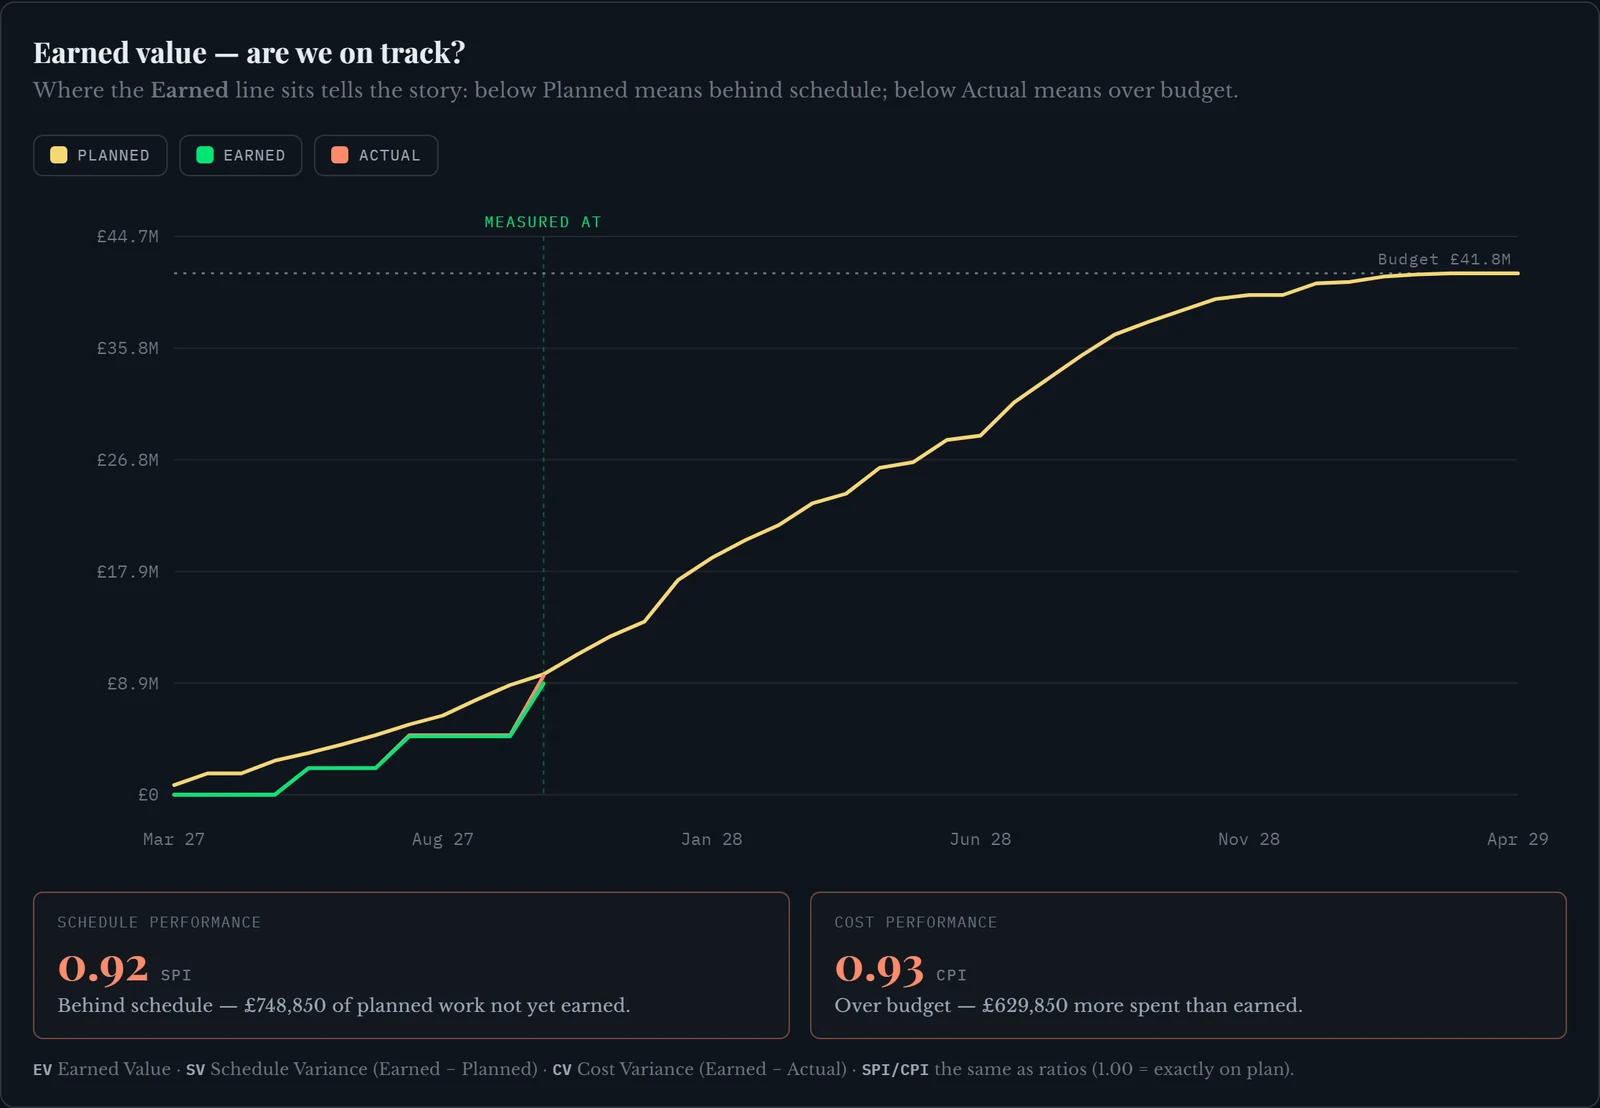
Still only £9.5M of a £41.75M budget spent. Not quite a quarter of the way through the money. And the forecast at completion had gone from £84,000 over to £2,954,322 over.
The bit that matters is the middle
Neither of those two screens is the interesting one. Put all three readings next to each other and the actual story appears.
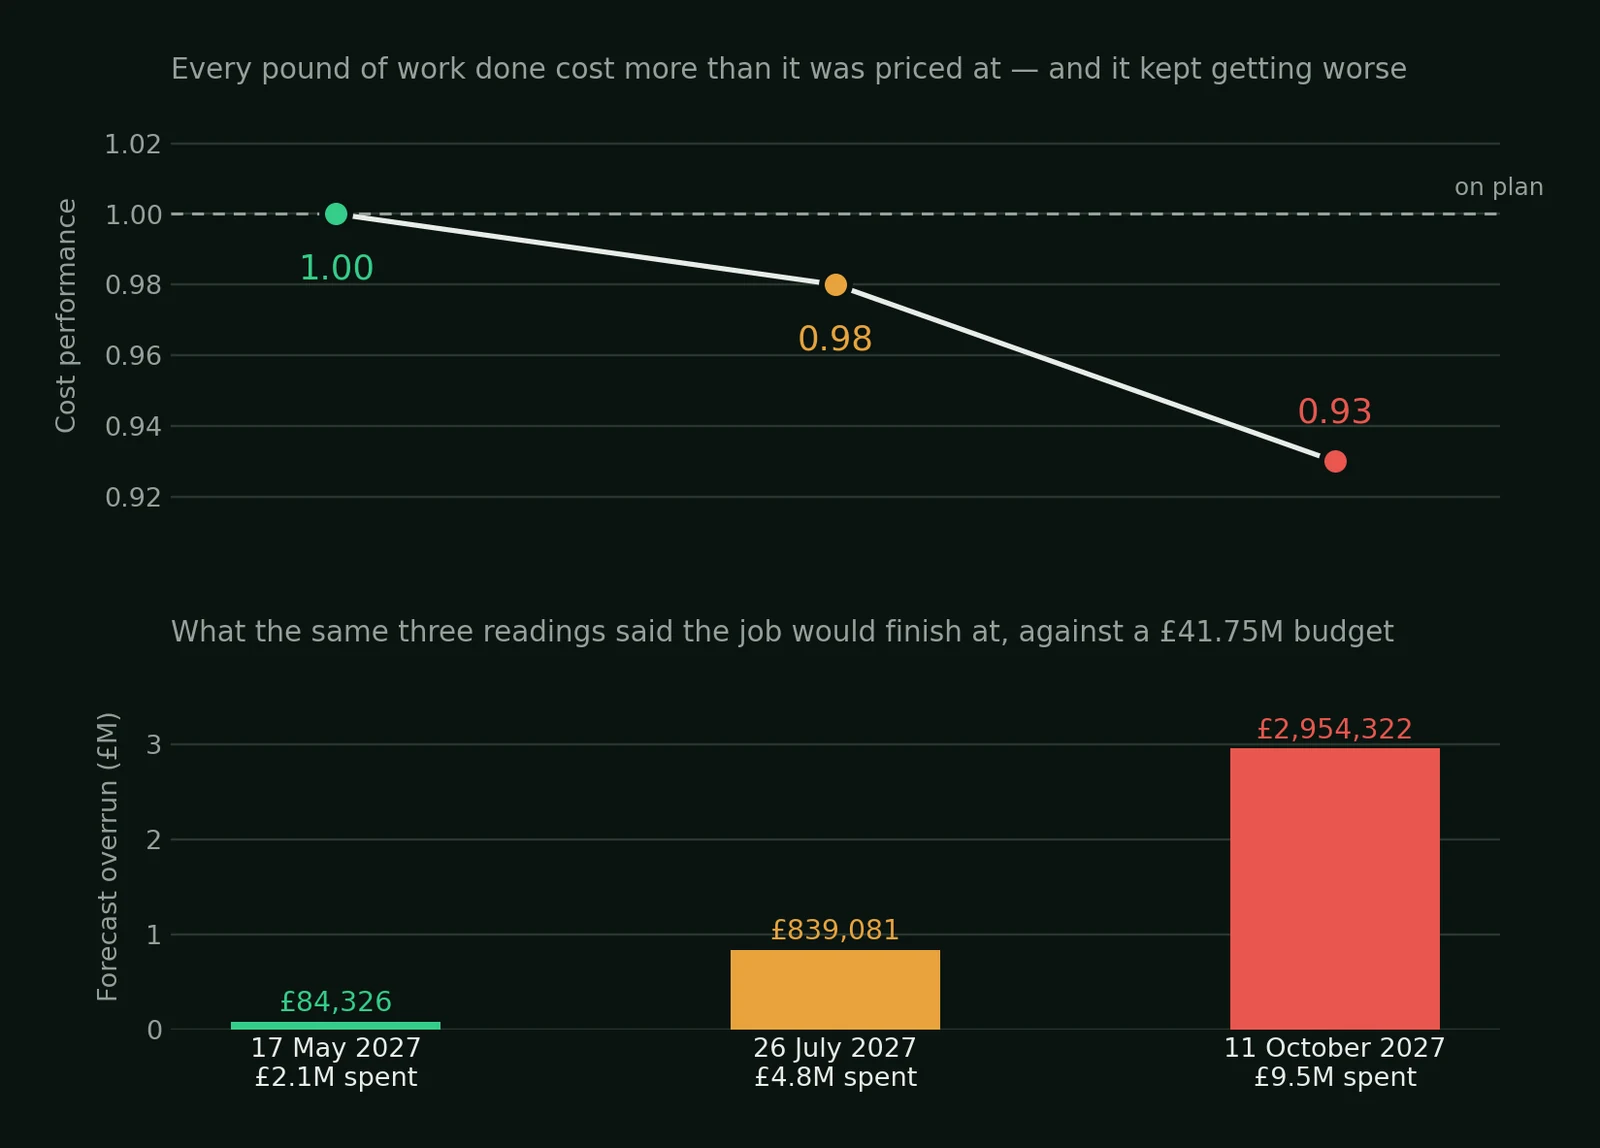
In July, cost performance was 0.98. Two per cent. On a job that size, two per cent is the sort of number you explain away without thinking — a slow start on the tank bases, some rework on a pour, weather. Nobody calls a meeting about 0.98.
But the forecast had already moved to £839,081 over. And more to the point, it was the second reading in a row going the same way. One bad month is noise. Two in the same direction is a trend, and a trend on a job this long is worth more than either reading on its own.
By the time it reads 0.93 and the number is three million, the useful decisions are mostly behind you. The structures that cost too much are built. What was available in July — change the gang mix, re-rate the remaining pours, challenge the method on the deep chambers — is gone by October.
Why the spend curve doesn't tell you
The obvious objection is that you would see this in the cost report. Here is the same job's spend curve at the same moment.
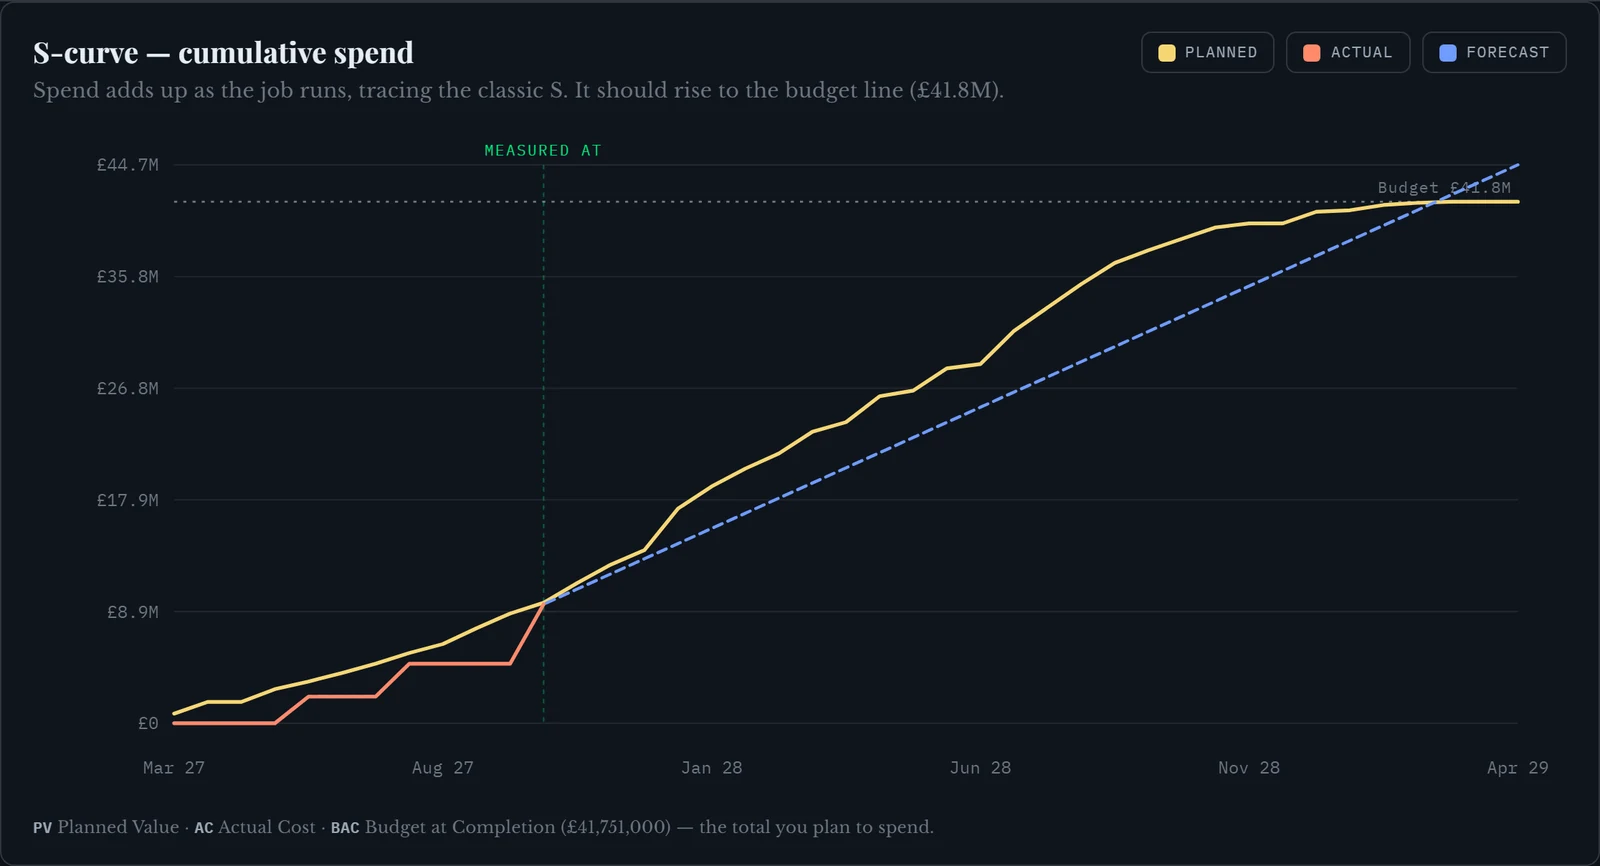
Money out is close to money planned. On a spend curve alone this job looks like it is tracking. That is exactly the trap: spending what you expected to spend is only good news if you also got the work you expected to get for it. Earned value is the second half of that sentence, and the spend curve cannot say it.
And the clock is running underneath all of it
There is a second number that does not appear in any activity's price.
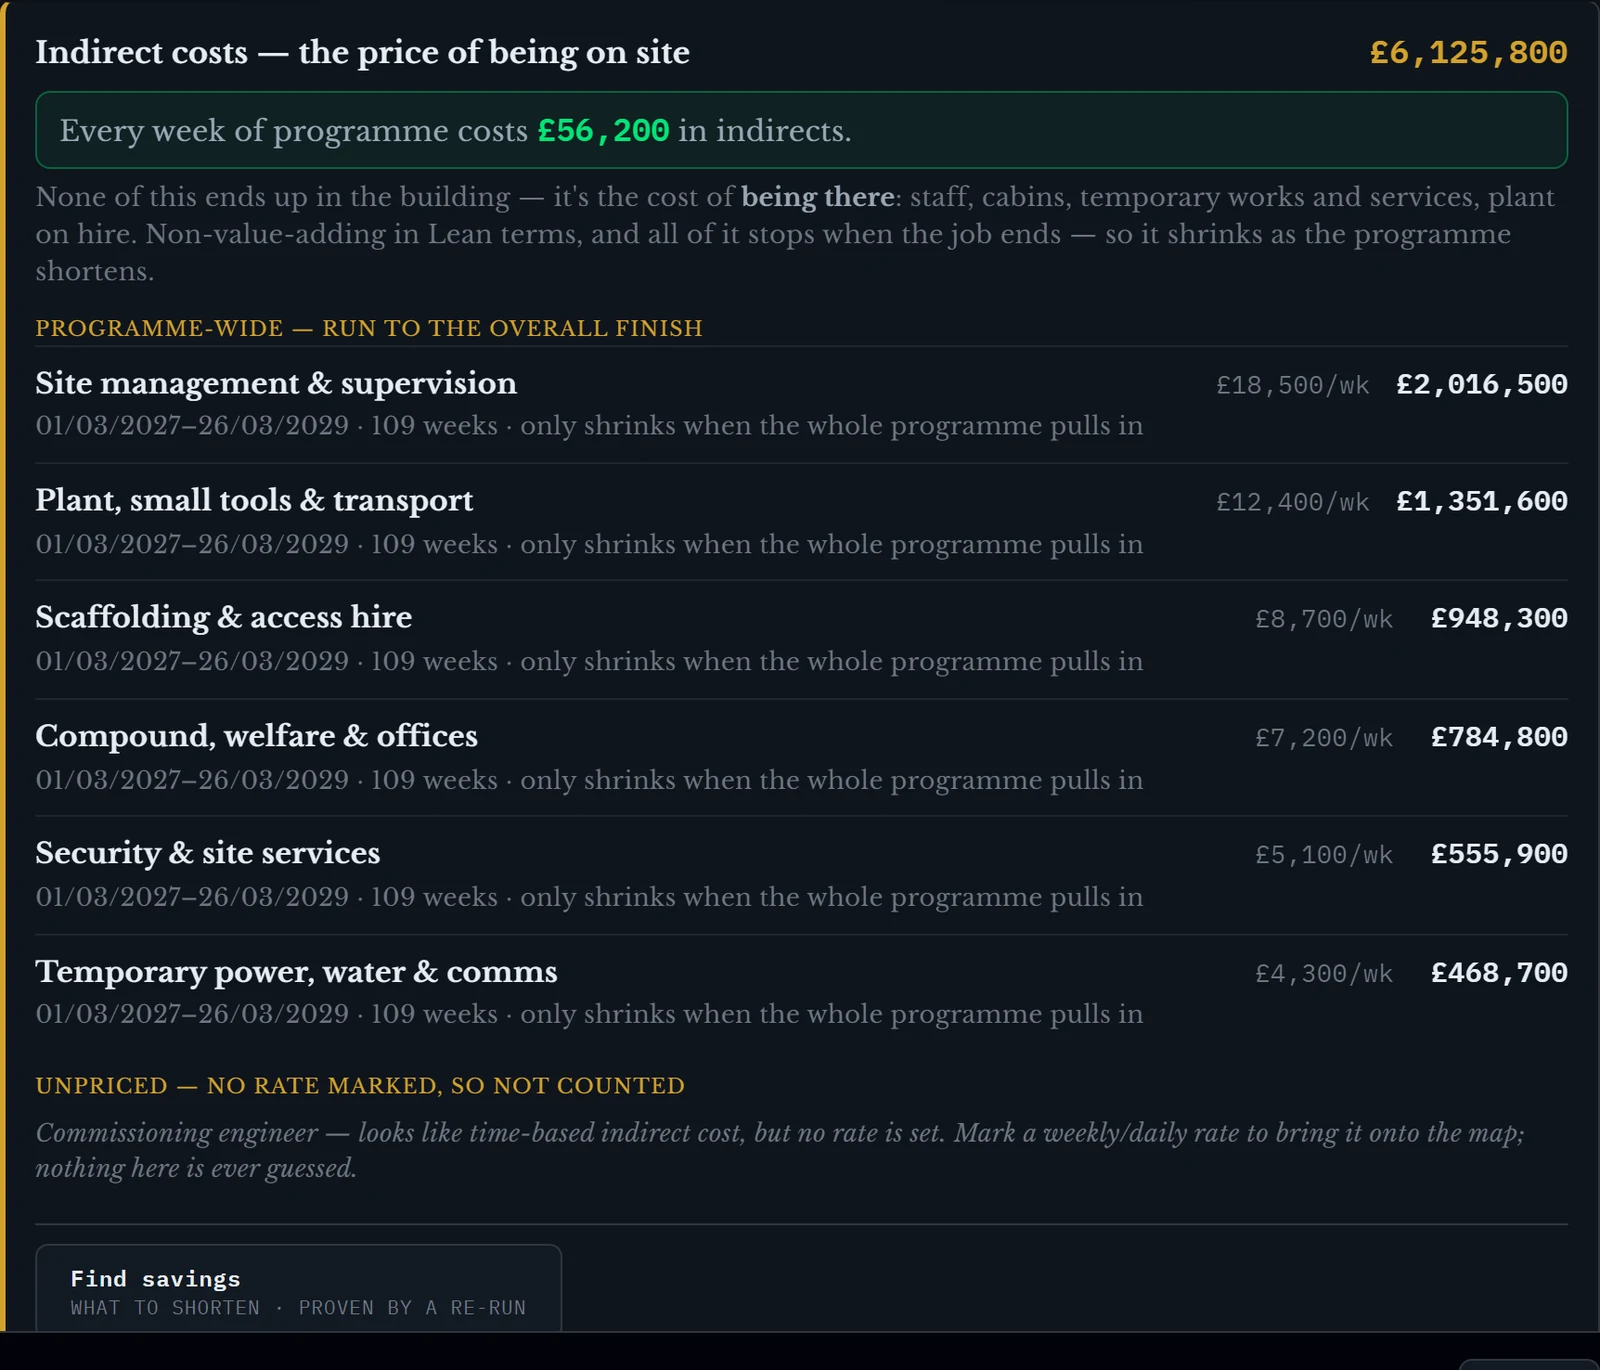
Which reframes any conversation about recovery. A fortnight of delay is not a scheduling inconvenience, it is £112,400 before anybody picks up a tool. And it works the other way too: pulling the programme in is worth £56,200 a week in money that simply stops being spent.
The part of that screen I would point at, though, is the bit at the bottom. The commissioning engineer is listed under "unpriced — no rate marked, so not counted". It looks like a time-based cost, it has no rate, so it is excluded and named rather than estimated. A tool that quietly guesses a rate there would produce a tidier number and a worse one.
Keeping the readings, not just the latest one
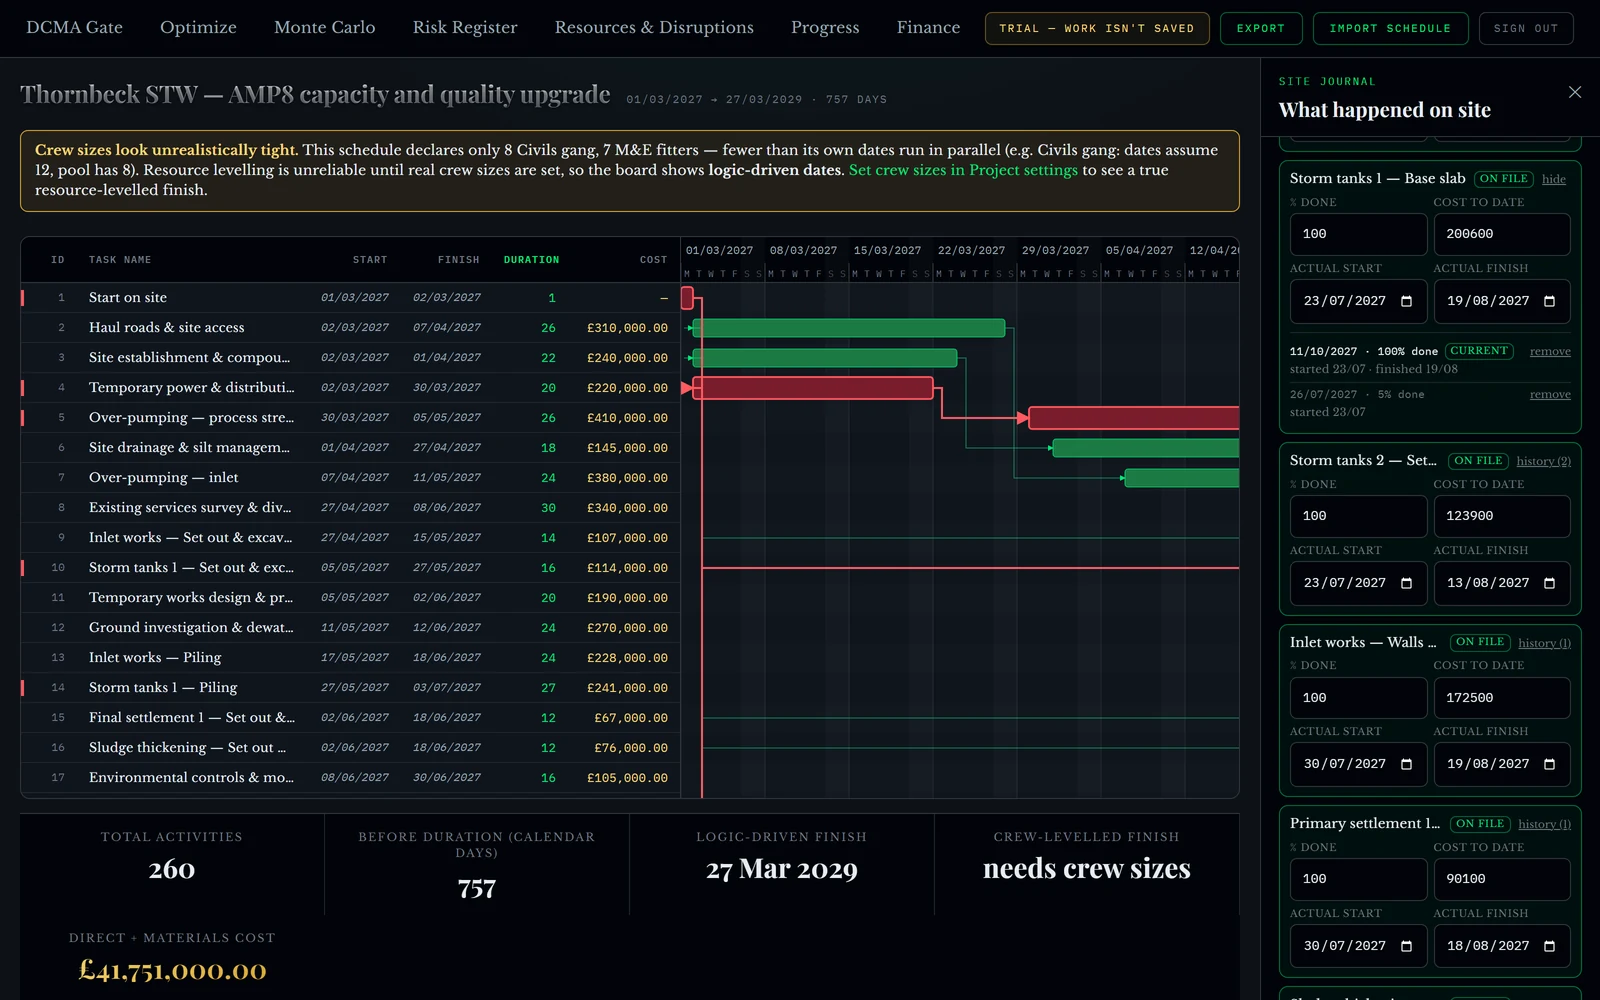
None of the above works without this. A trend needs the old readings to still be there, dated to when they were taken — not overwritten each time somebody updates a figure. Every per-cent observation stays on file against the date it was reported against, which is what lets the job be re-read as it stood in July rather than as it looks today.
What this does not tell you
Two honest limits, because a money tool that oversells itself is worse than a spreadsheet.
The schedule performance figure reads harshly in the early months — 0.72 in May. That is largely an artefact: planned value is booked in full on the day an activity starts rather than spread across its duration, so anything that began last week puts its whole budget into the planned side and almost nothing into the earned side. It settles down as the job runs (0.92 by October), but early on the cost figure is the one to trust.
And the forecast at completion assumes the rest of the job performs the way the job has performed so far. That is a reasonable assumption and not a certainty. If you genuinely fix the thing that was costing you, the forecast is pessimistic — but you have to actually fix it, and the number is there to make that a decision rather than a hope.
Run it on a job you are reporting on now
GeneraGantt reads MS Project, Primavera P6 and Asta Powerproject. Price the activities, record progress against a date, and the earned value, the forecast and the standing costs all come from that same set of numbers measured at the same stated day — so the cost report and the programme cannot disagree.
It is free while it is in testing, with a sample programme loaded. Nothing is saved: your schedule leaves with you.
The programme in this article is a generated one, built to behave the way a job behaves when the civils cost more per structure than they were priced at. Every figure quoted is read off the app after importing it and recording three rounds of progress — the trend chart is drawn from the three readings the app reported at those check-ins.