On a live treatment works the dangerous fortnight is the one where the works stops being a works. The operator closes the penstocks, the flow goes round the job in temporary pipework, the tankers start their circuit, and you have the days you were given to cut into a chamber that has been passing sewage for fifty years, connect the new inlet, test it, and hand it back.
Overrun and nothing dramatic happens. The over-pumping stays on. The tankers keep running. And the operator, who has a consent to keep and a river downstream, rings every morning with the only question that matters: are you handing back on Friday or not.
An earlier piece here was about a whole job's finish date. This one is about ten days in the middle of one.
The programme
A generated inlet works and pumping station upgrade on a running plant, built to behave like the real thing: 449 activities, twenty months, £21,399,600 of priced work, seven resources on hourly rates. New inlet structure, screens and grit, a pumping station, MCC and MEICA, dry commissioning, the shutdown and tie-in about fourteen months in, then wet commissioning and proving.
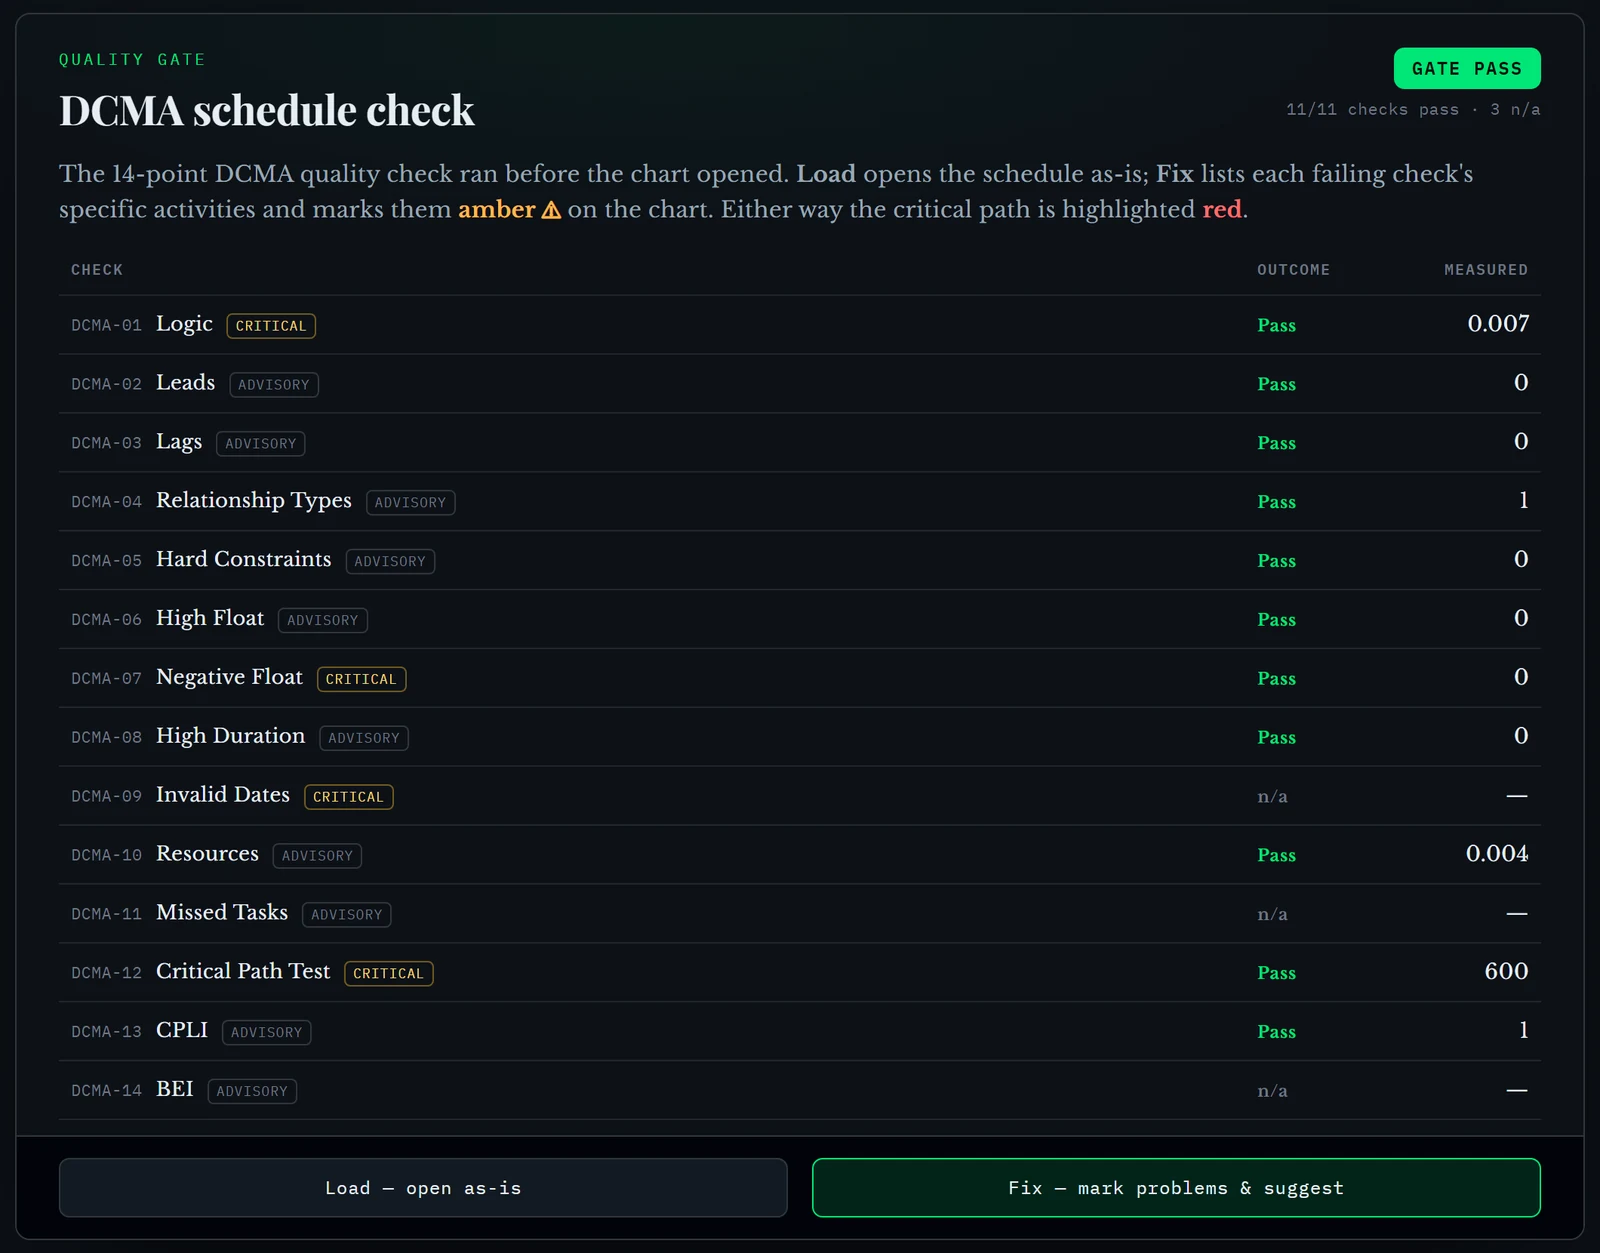
This is not an article about a broken programme. The logic is sound and the plan finish, 7 November 2028, is the deadline. Everything below happens to a decent one.
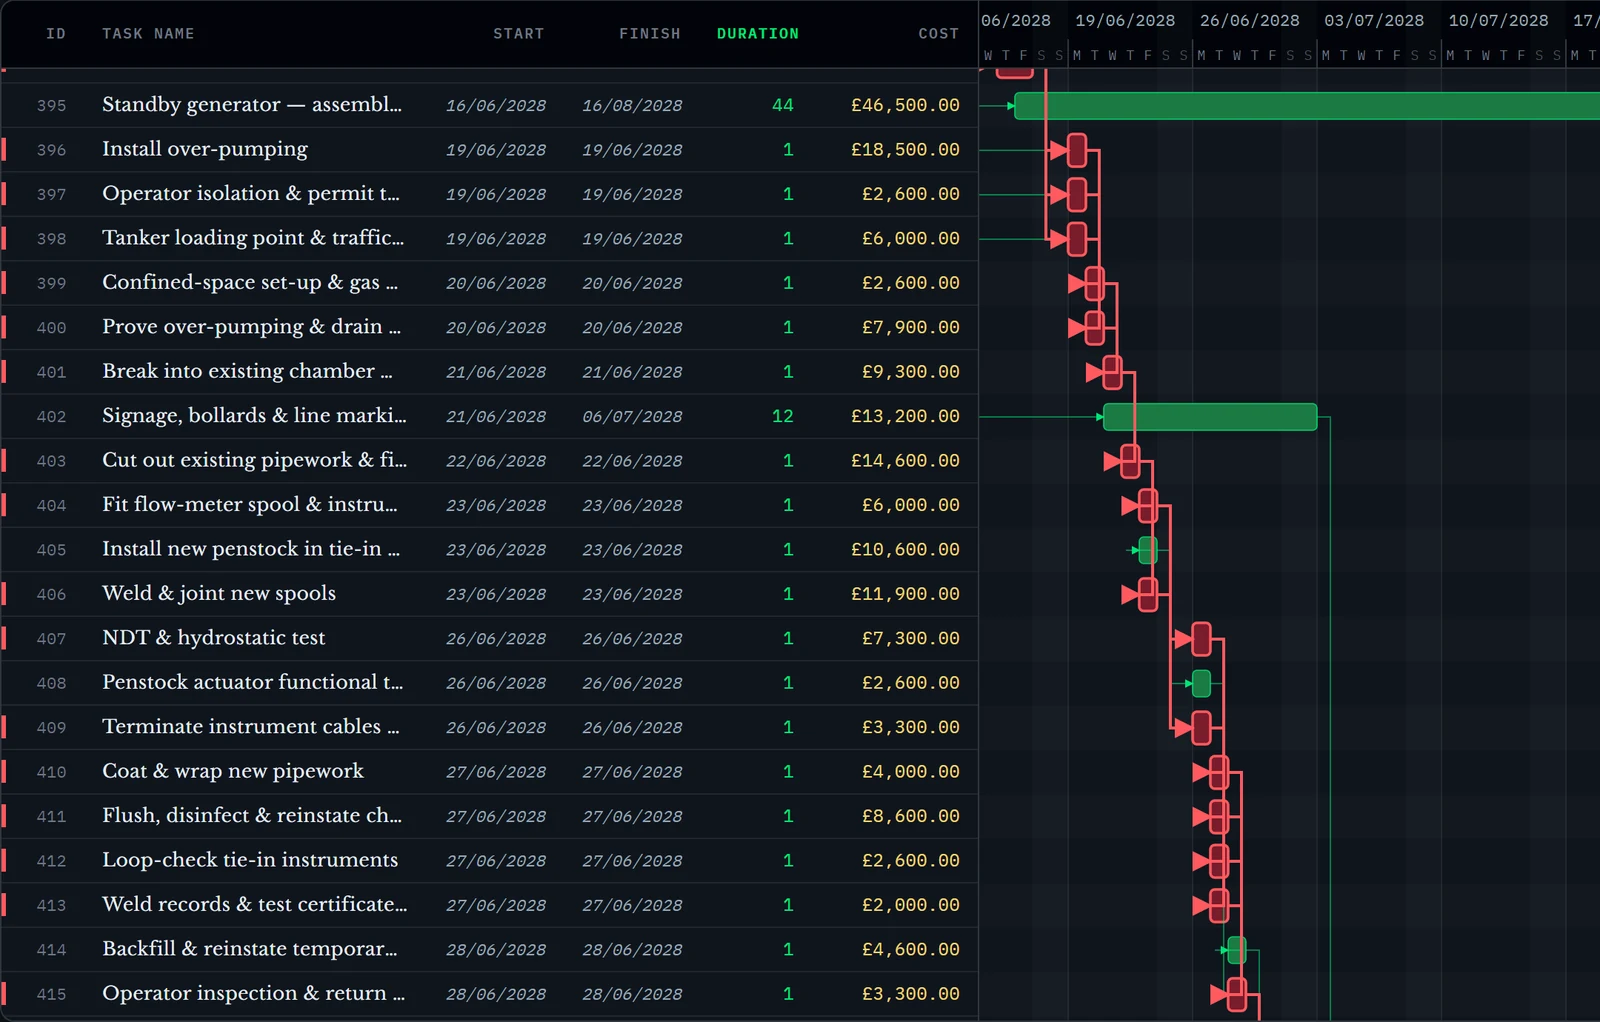
Inside the window there are twenty-two activities in whole working days, because whole working days are what the tool works in. The chain that matters runs isolate, over-pump, drain down, break in and survey what is actually there, cut out and connect, weld, test, reinstate, operator inspection and return to flow. Eight days. Two spare.
The whole job's odds, and why they are the wrong question
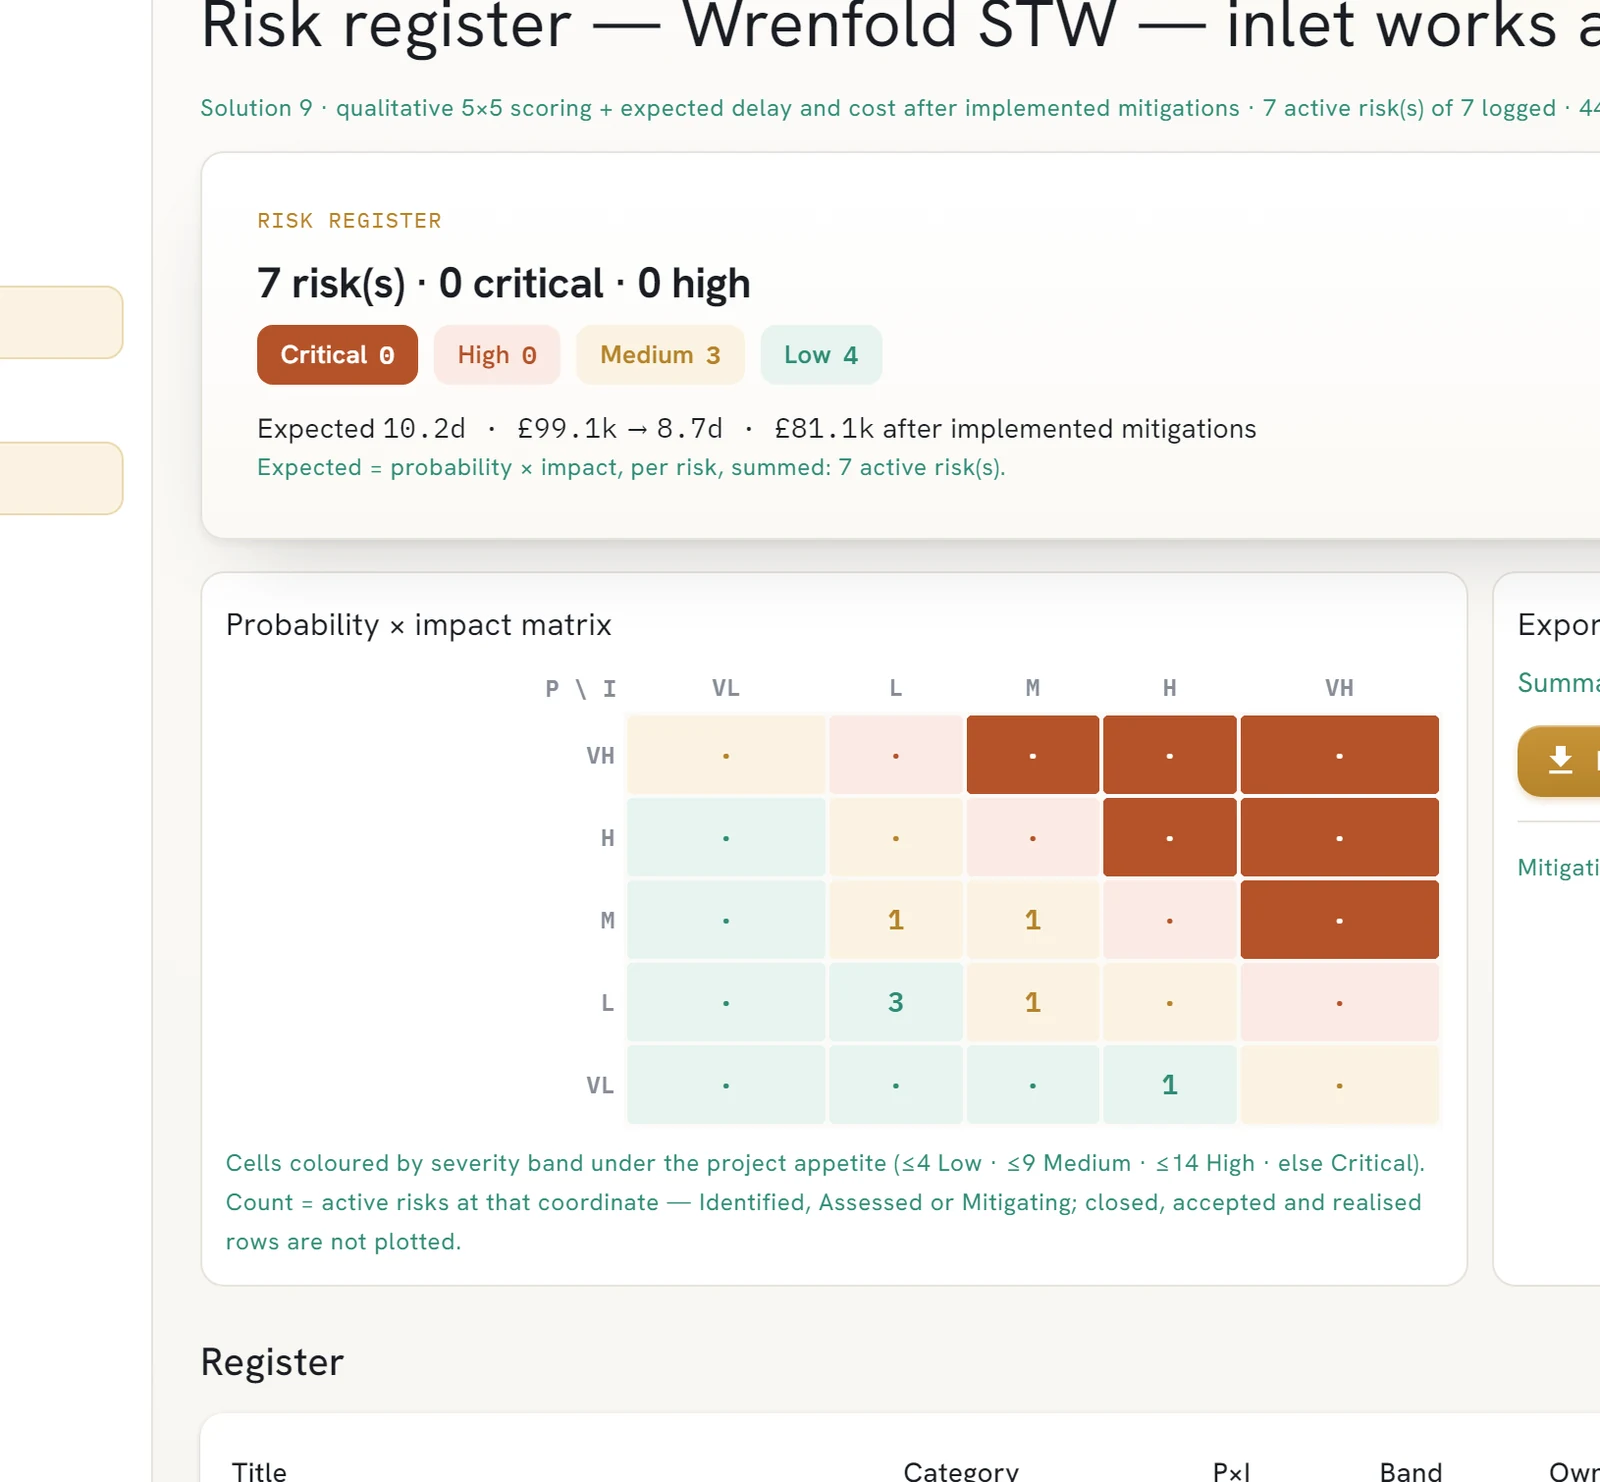
Run the whole programme first, every activity on the importer's default range, with the register as logged: six risks against the tie-in and one outside it, each with a likelihood band, a delay in working days and a cost in pounds, linked to the activity it would hit.
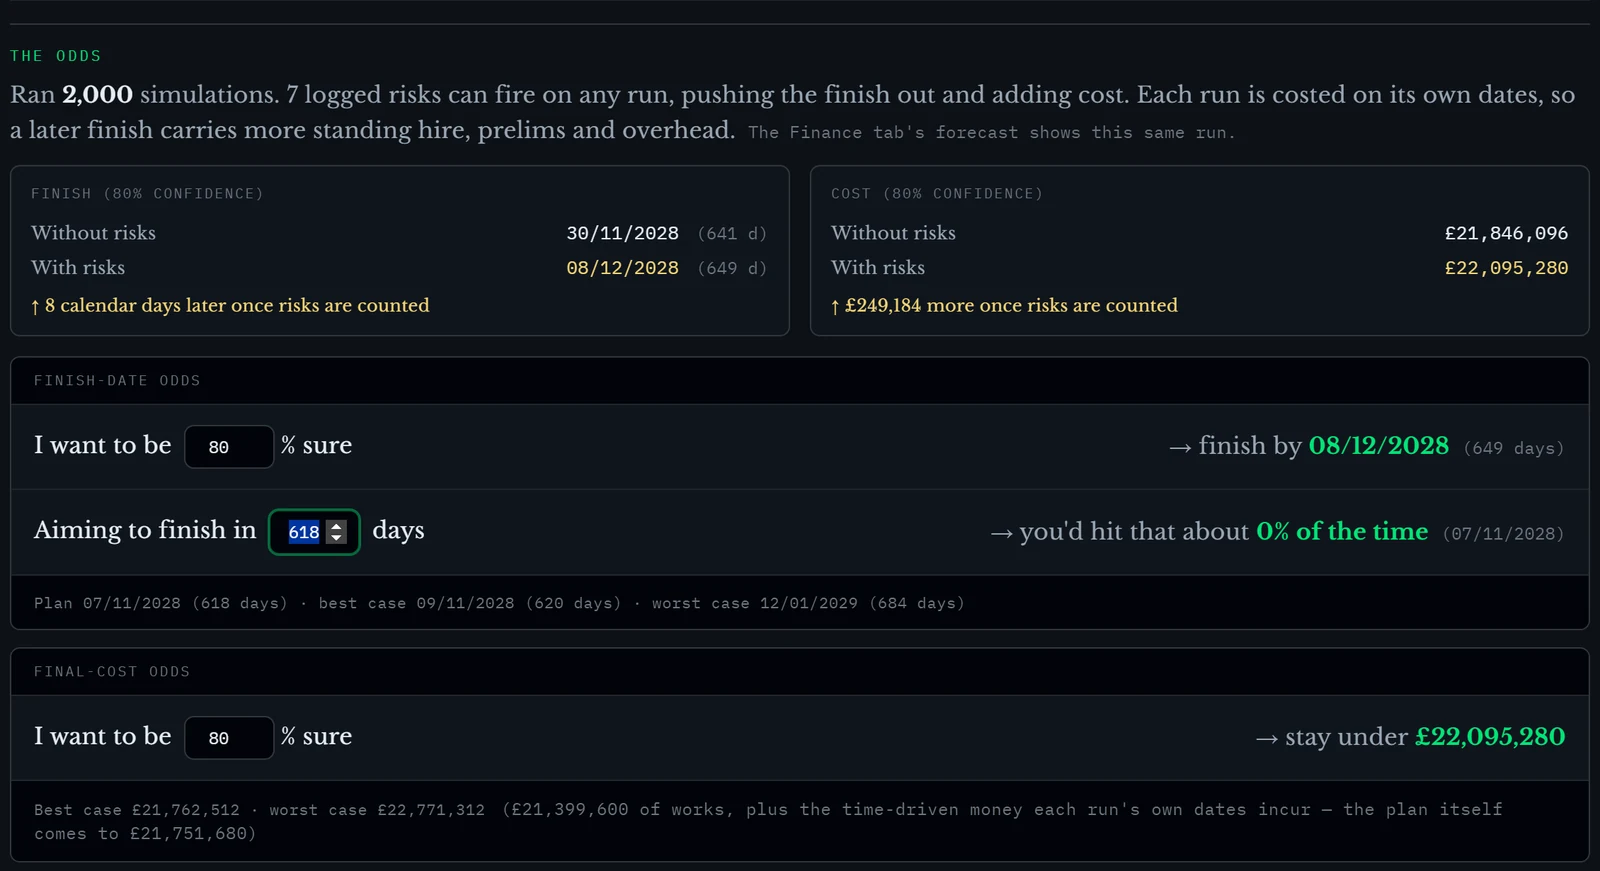

All true, and all beside the point. A month late on a twenty-month job is a conversation about damages next year. The operator wants to know whether the flow is back on the Friday of the second week in June, and the whole-job number cannot say, because 449 activities are varying at once and the window is nine of them.
Narrowing to the window
So narrow it. Set the panel's From and To to the ten working days the operator granted, 19 to 30 June 2028, and the list drops from 449 activities to 27.
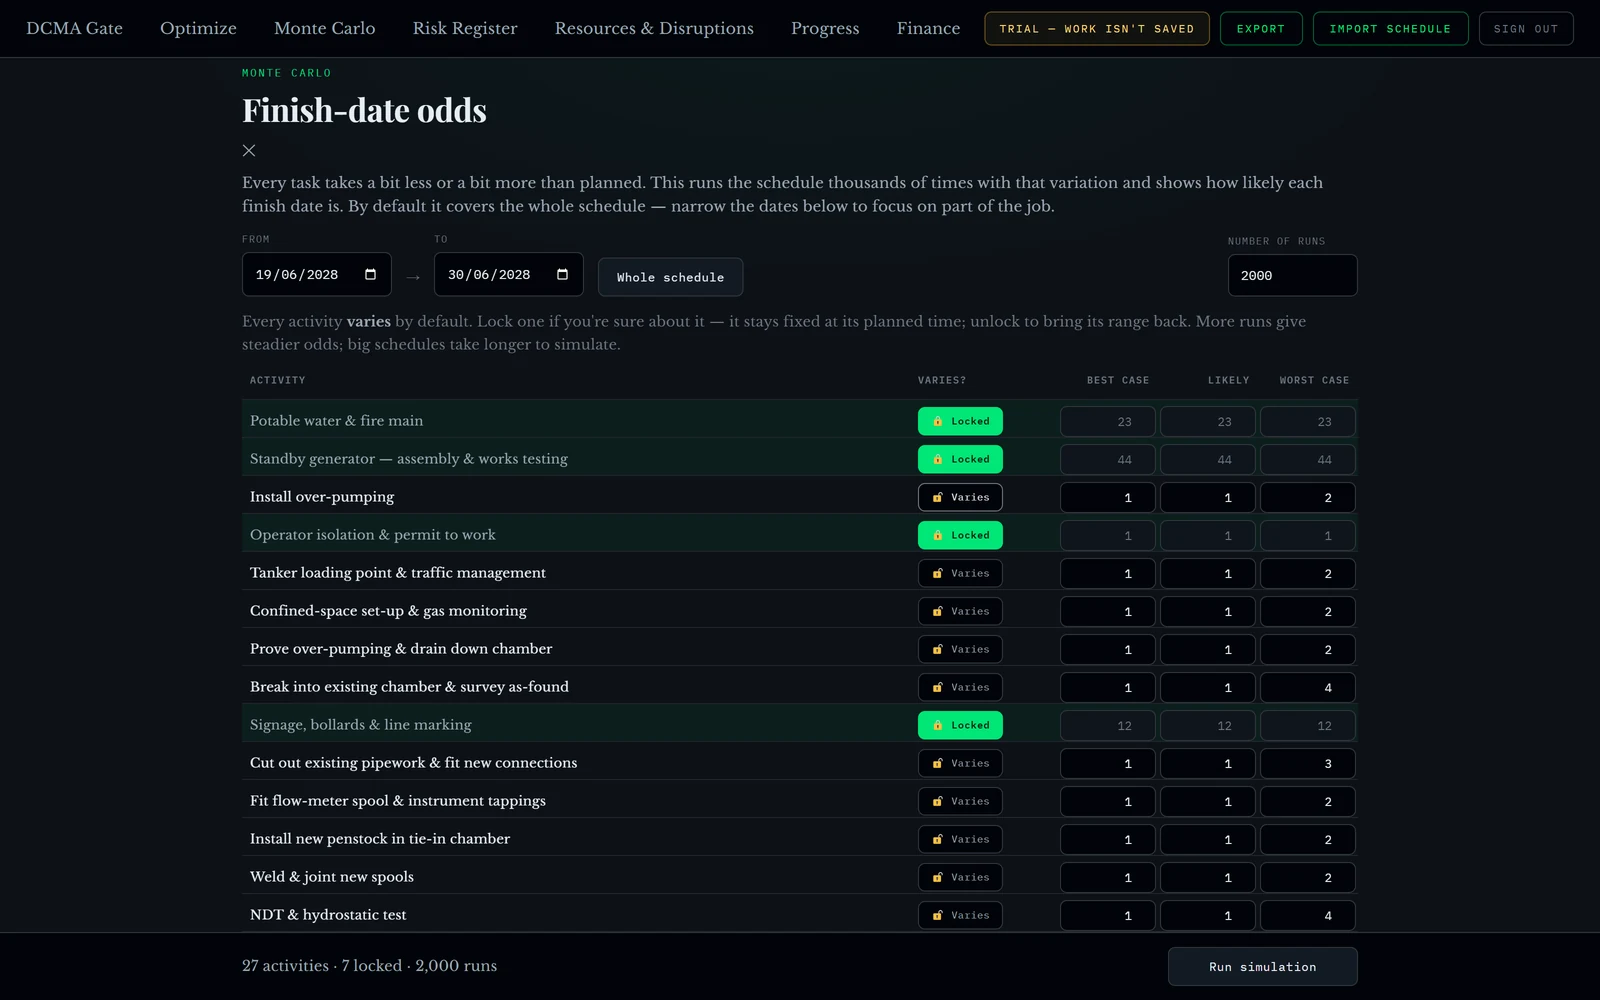
Five of the 27 are other work that overlaps the fortnight: a water main, a generator on a factory floor, some signage, and the two wet-commissioning activities that start the moment the flow is back. I locked those five so the only thing moving is the tie-in, and two more: the operator's isolation, and the operator's inspection and return to flow. Those are the operator's hours, not ours.
The importer gives every activity a default range of one day under and two over its plan. On a forty-day pour that is 39, 40, 42, barely a range. On a one-day activity it is 1, 1, 3, wrong the other way. So for the chain I typed what a site engineer gives you when you ask properly. Break into the chamber and survey it: a day if the pipe is where the drawing says, four if it is not. NDT and the hydrotest: a day if it holds, four if you chase a leak. All skewed the same way, because nothing in a live chamber finishes early.
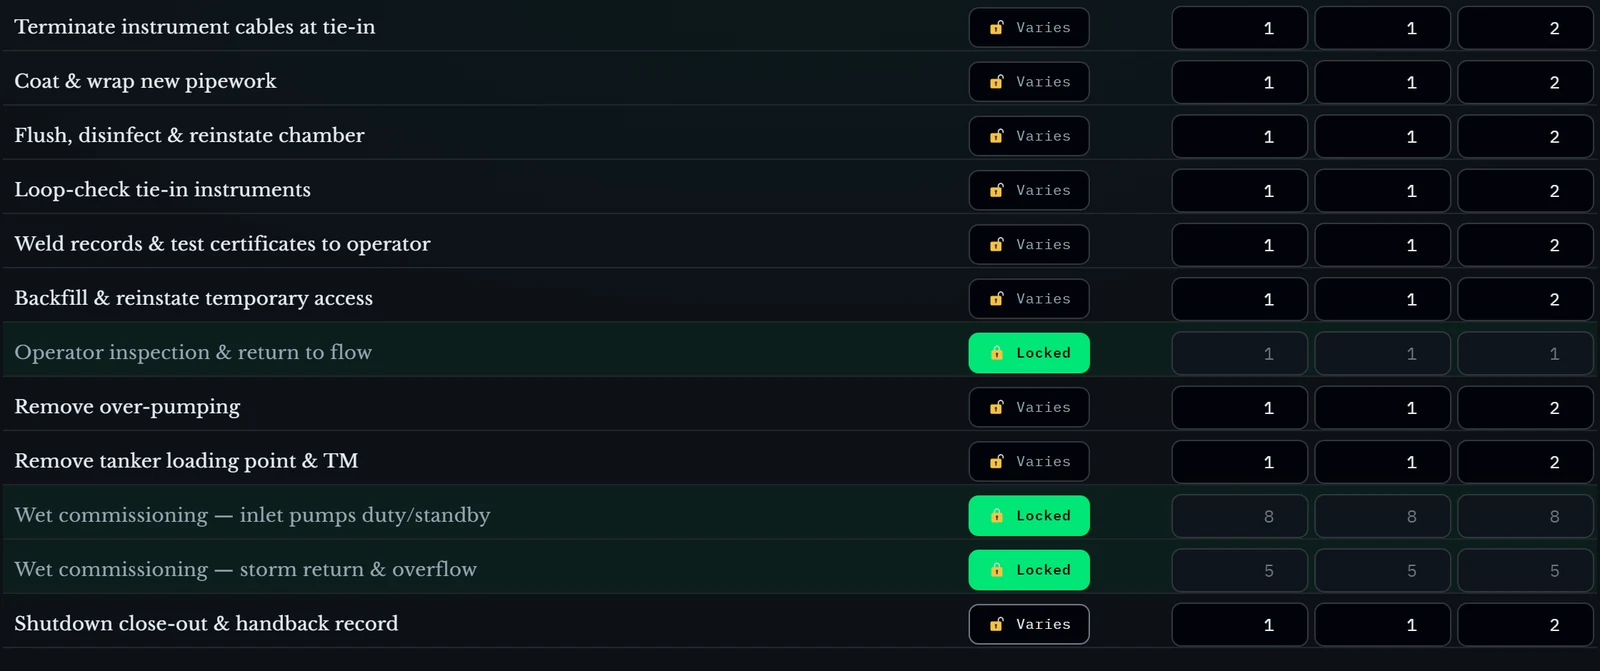
The rest of the programme stayed on the defaults: outside the window, the ranges are the importer's guess, not anybody's judgement.
Fifteen per cent
One thing to know first. The window does not change what the panel reports: it still gives you the job's finish. What it changes is which activities vary and which risks count. The tie-in here is on the critical path with no float behind it, so every day lost inside the window is a day on the finish, and "hand back inside the ten days" is the same question as "finish within two working days of the plan". That is 620 days from the start against a plan of 618, so 620 went into the lookup.
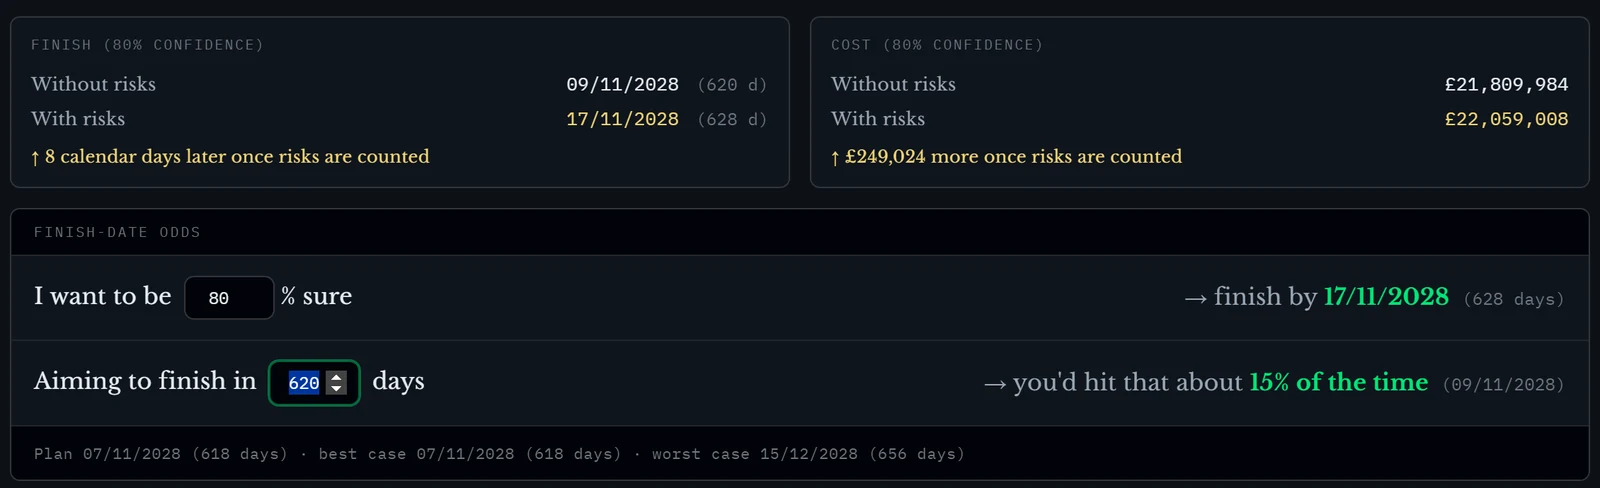
The two halves of that are the whole article. The ranges on their own are fine: with no risks counted, eight runs in ten hand back inside the window. The register takes it away. Six ordinary tie-in risks, none rated high, and the odds drop to about one in seven. To be 80% sure you need until 17 November, eight working days past the plan and a tie-in of sixteen days. To be 90% sure, the 24th: twenty-one days in a ten-day window.

The pump risk is real and in the forecast; it just cannot eat the window, and the panel says so.
What that number costs
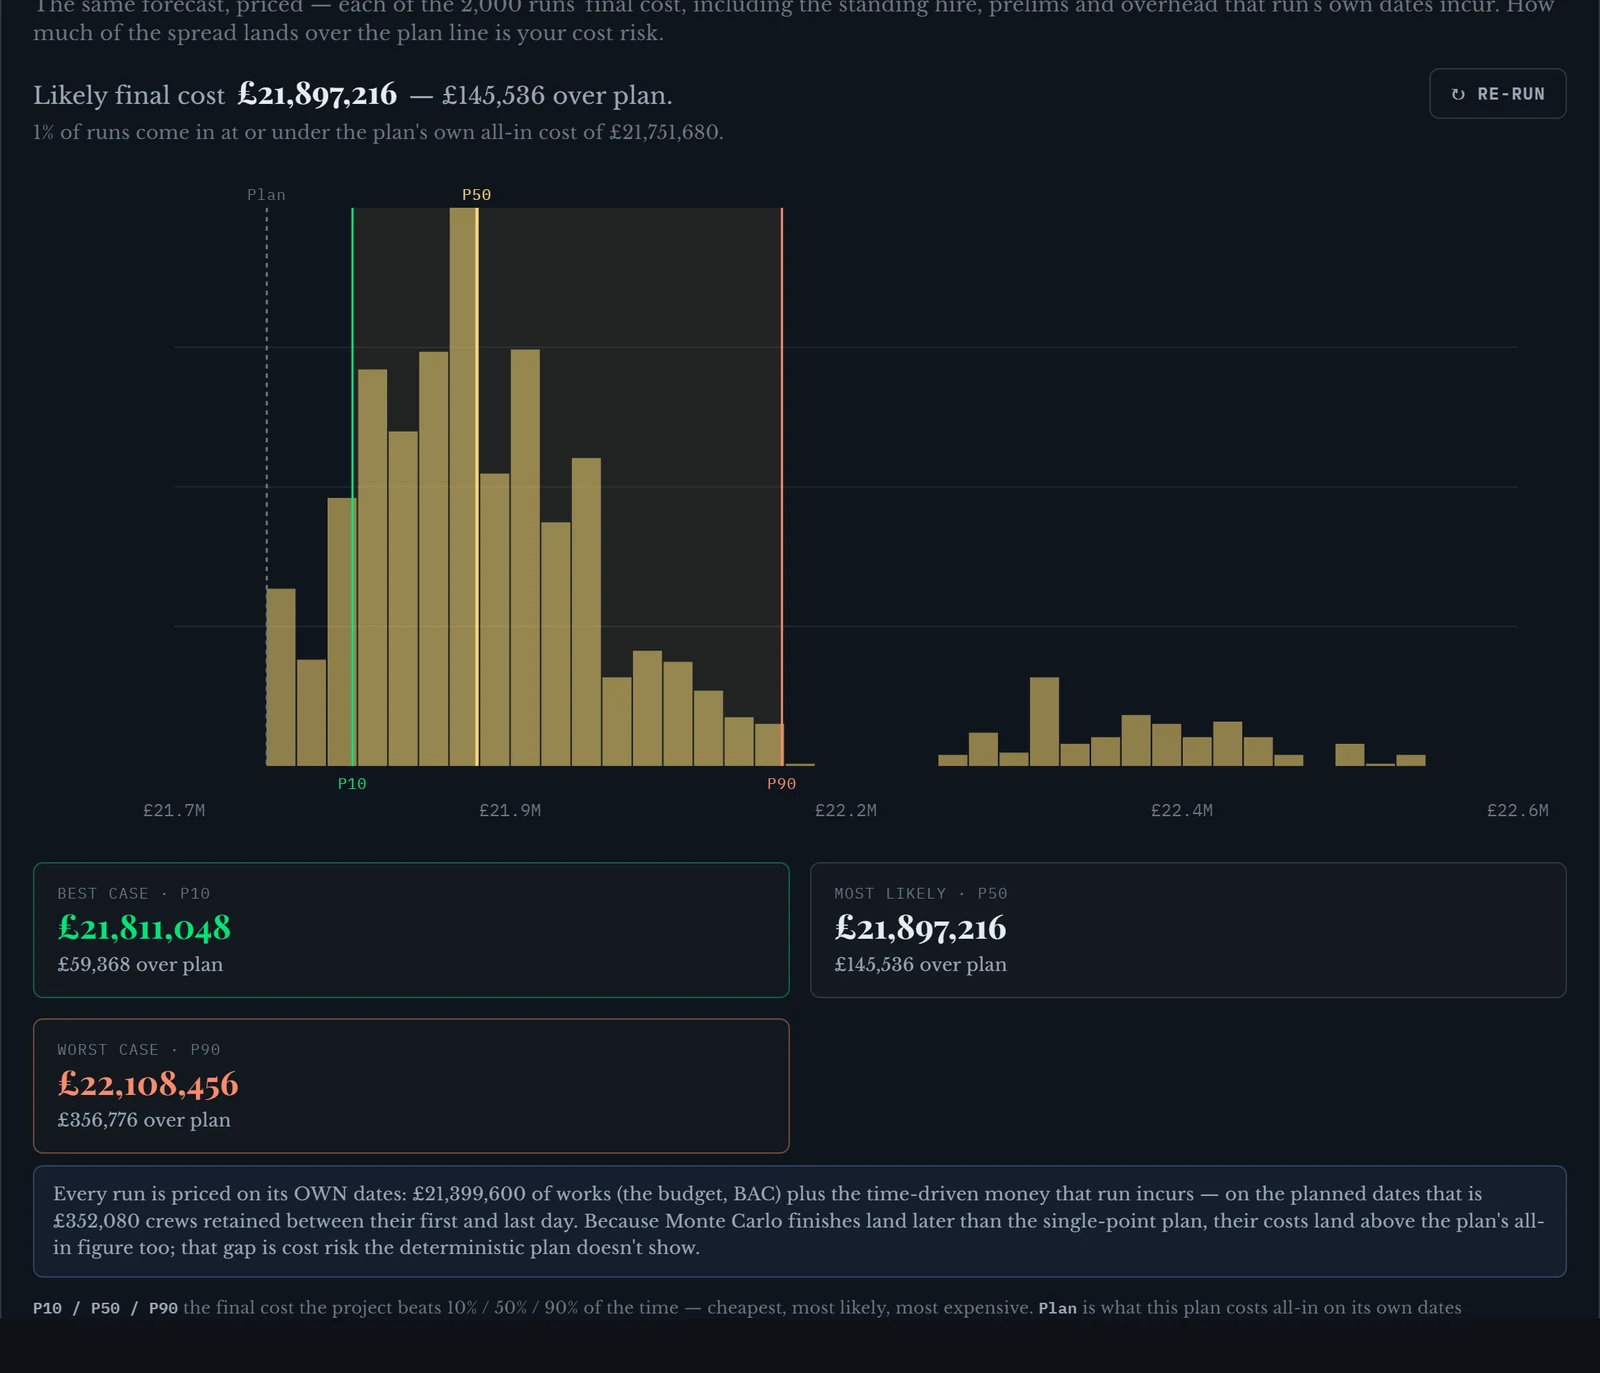
The over-pumping and the tankering are on the programme as rated resources, assigned to the day they go in and the day they come out. The days between are hire, and the tool prices them: in this file £13,680 a working day, £4,480 of pumps and £9,200 of tankers, for every day the handback slips.

The best case equals the plan because a one-day activity cannot take less than a day. Everything above it is hire running on, the risks' own costs, and standing money. At 80% that is £249,024 more than the same runs without the register.
What moved the odds, and what did not
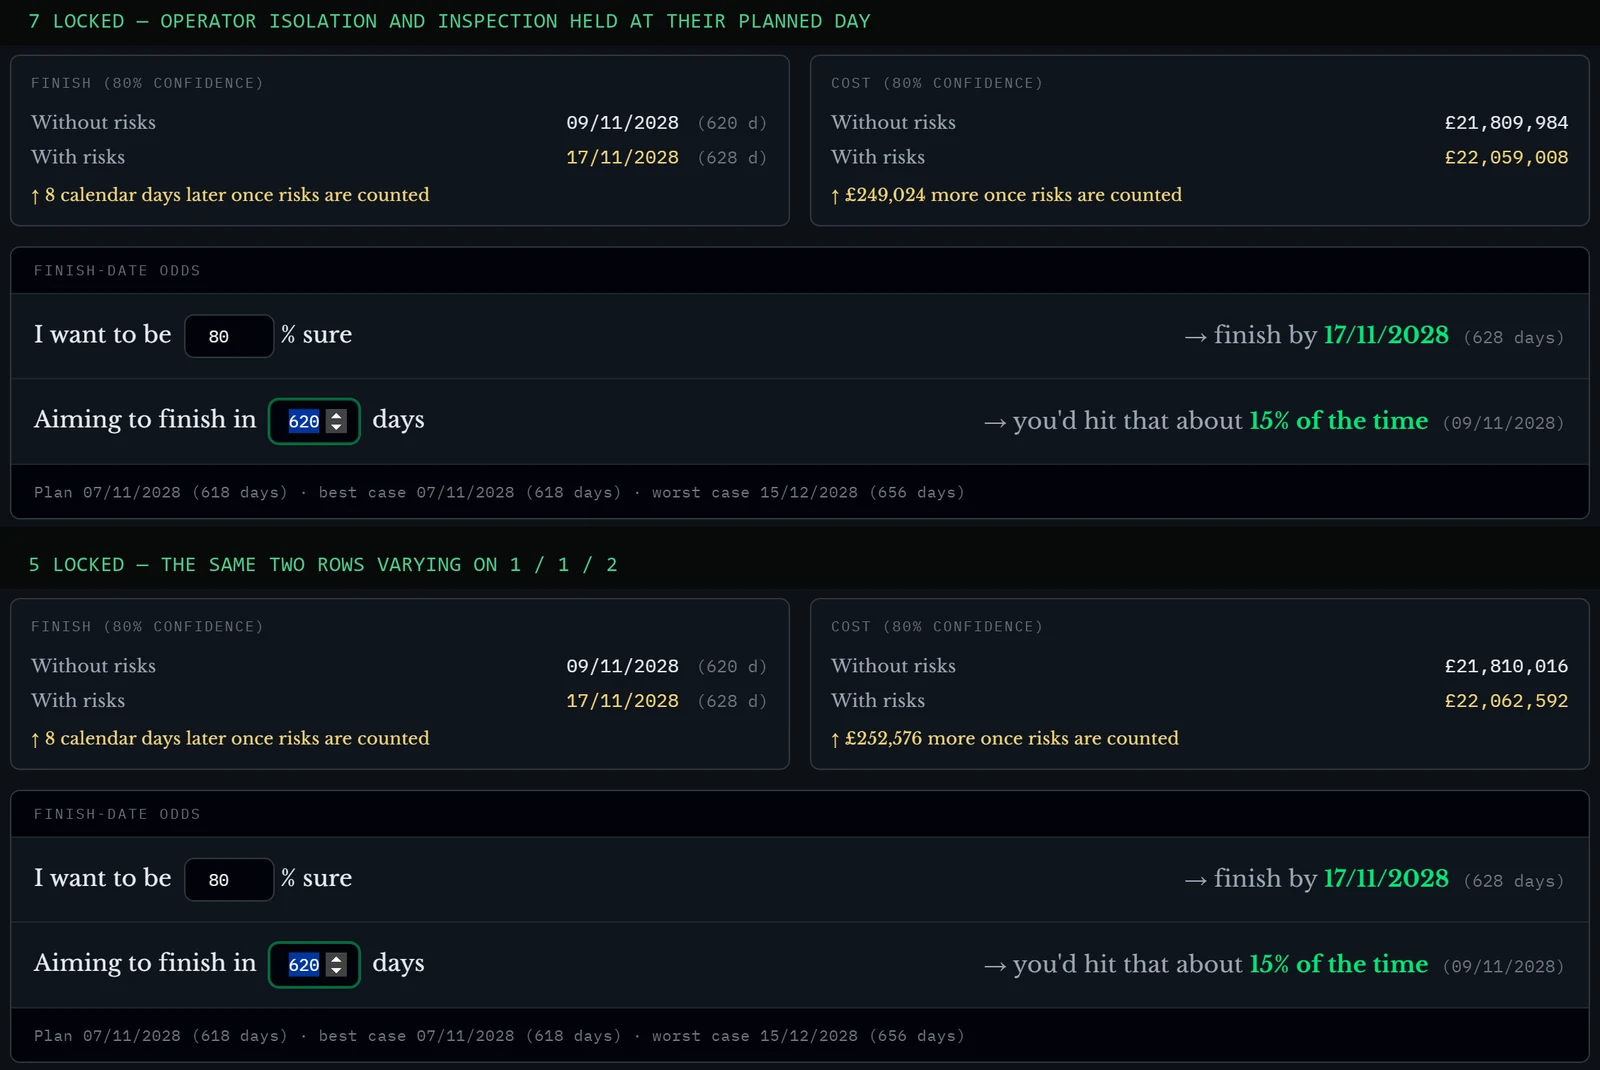
Locking the operator's hours was worth nothing here, and I would rather print that than pretend. Both are one-day activities on a one-to-two range, the isolation runs alongside the over-pumping install, and the sampled days round back to one in almost every run. On this window the certainty was already priced in.
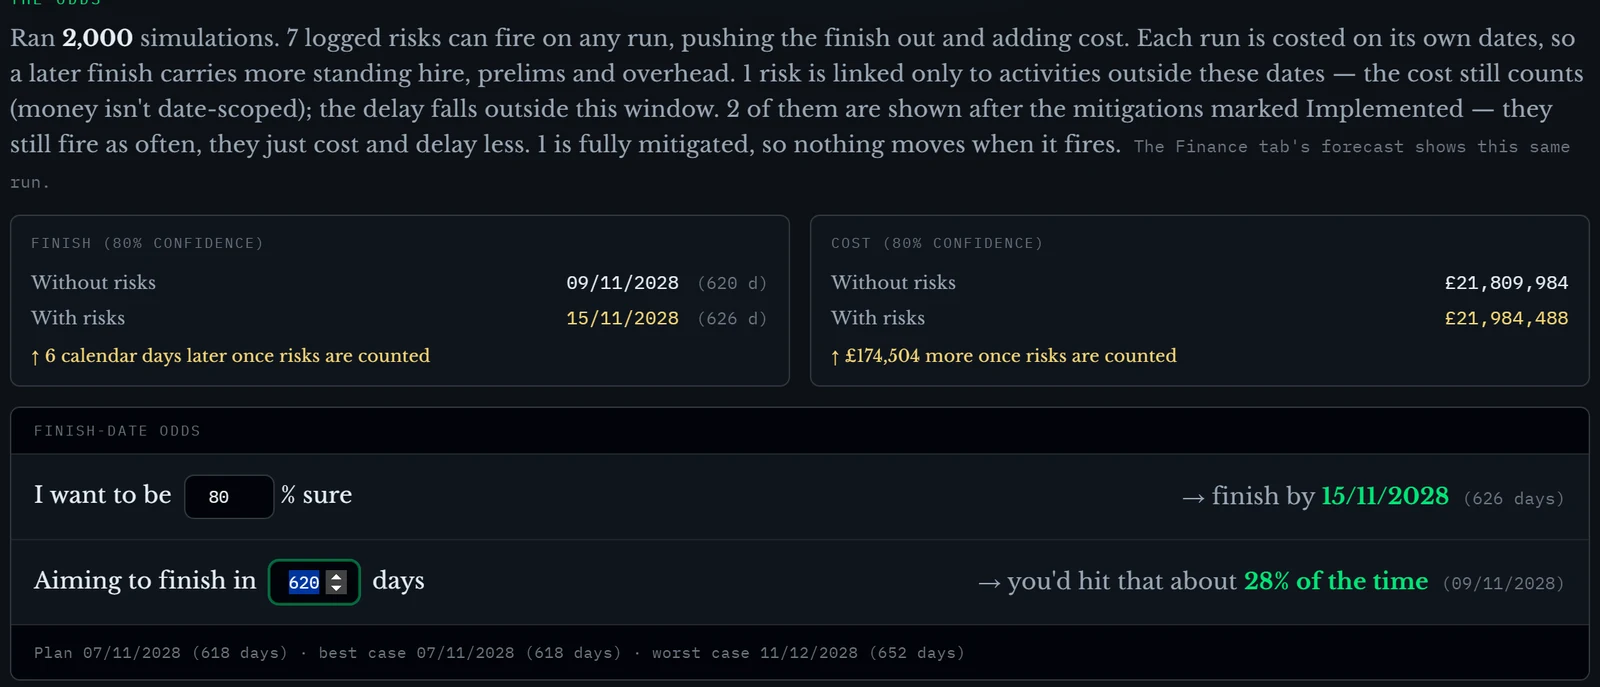
The mitigations nearly doubled the odds, for £15,000 of trial holes and a trial fit. They do not make the window likely; one in four is still a bad bet with the operator on the phone. But the register said which two lines were worth the money and the panel said what they bought, and that is a conversation for March, not June.
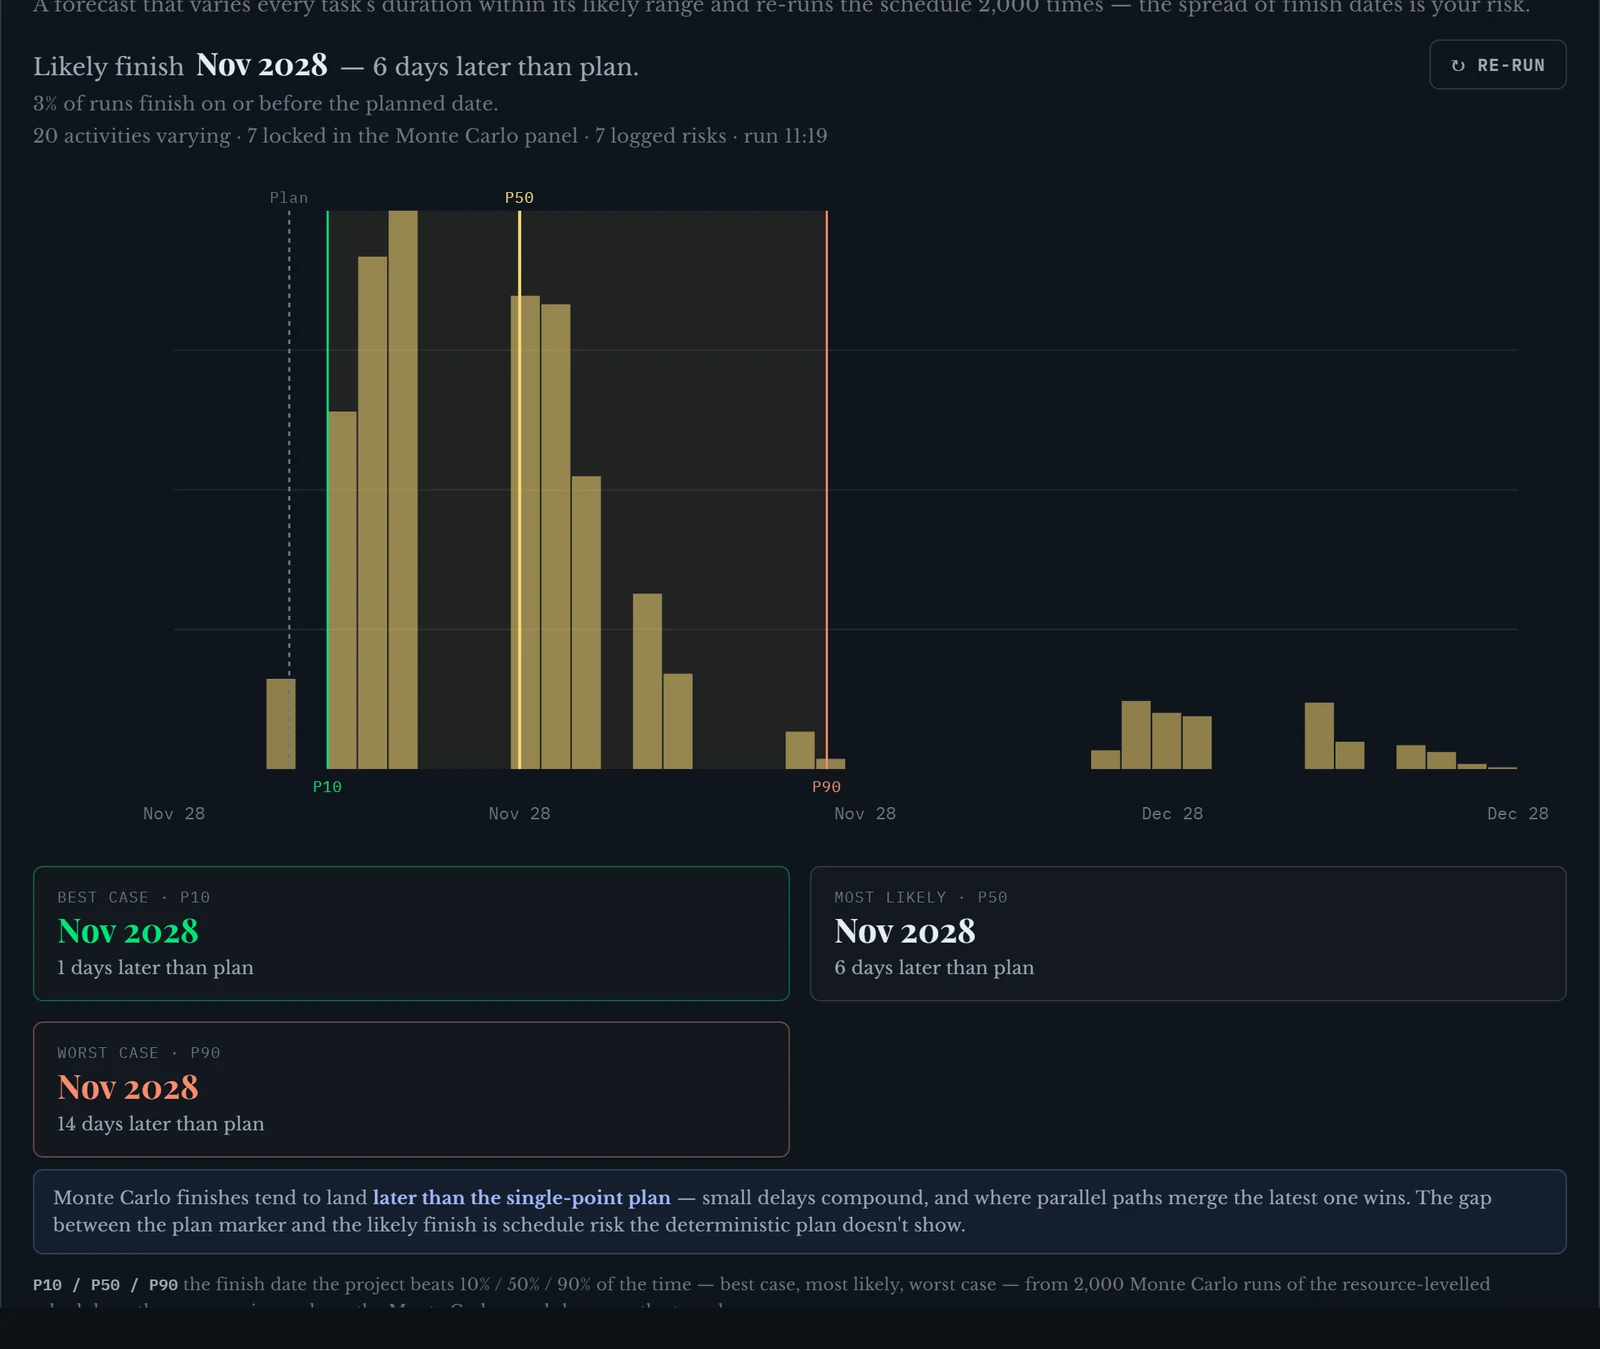
What this does not tell you
Three honest limits. The ranges outside the window are the importer's defaults, so the whole-job figures are rougher than the window figures. Every activity varies on its own: a bad day breaking into the chamber does not make the next day worse, and on site it does, because the thing you found is still there tomorrow. And the ranges are exactly as good as the engineer who gave them; feed the panel a hopeful set and it hands back a hopeful percentage with the same straight face.
It also works in whole working days. Half a day to break in and three if it goes wrong becomes one and four, which is why I would not quote the 15% to a decimal place.
And one thing this run found rather than assumed. The first pass put the 80% and 90% finishes on Saturdays. That was a bug in how a simulated finish landed on the calendar: the engine's finish is the morning after the last day worked, and the date was being read off that morning. It is fixed, every finish date in the app now names the last working day, and the figures above are from the run after the fix.
Run it on your own window
GeneraGantt reads MS Project, Primavera P6 and Asta Powerproject. Open the Monte Carlo panel, set From and To around the dates you are worried about, type the ranges the people doing the work will stand behind, and read the percentage. Free while it is in testing, with a sample programme loaded. Nothing is saved: your schedule leaves with you.
The programme in this article is a generated one, built to behave the way a works upgrade behaves when a live tie-in sits on the critical path. Every figure quoted is read off the app after importing it, logging the register and running the panel; the day rates for the over-pumping and tankering are the ones written into the file.