I have written a fair few risk registers. Every one of them was a spreadsheet, every one had a Likelihood column and an Impact column graded High, Medium or Low, and every one was written for the tender and then never opened again.
It is not laziness. The register gets ignored because it cannot answer the only two questions anyone in a project meeting actually asks: how many days, and how much money. "Ground conditions: amber" answers neither. It is a feeling with a colour attached.
Every risk in days and pounds
So in GeneraGantt a risk carries a likelihood and an impact in the units the job runs on. Probability times impact, kept in days and in pounds, and never collapsed into a single score that hides both.
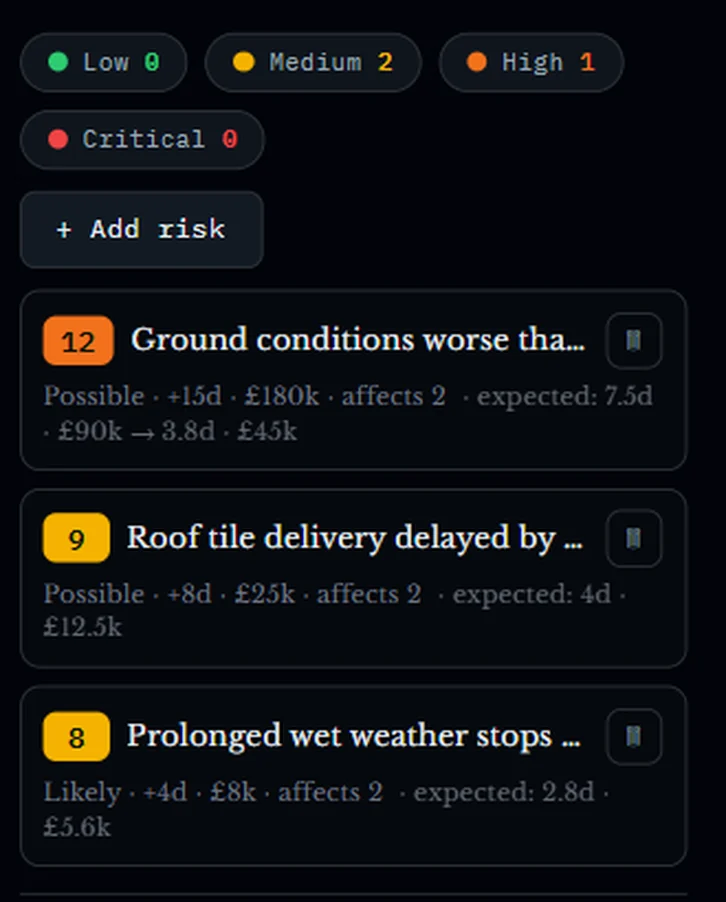
That one line is worth more than a whole page of amber. It tells a client what the exposure is, it tells a QS what to carry, and it can be argued with on its own terms — someone can say the fifteen days is really eight, and then you have a conversation rather than a colour.
Linked to the work it would actually hit
A risk floating free of the programme is a note. A risk attached to activities is something the schedule can do arithmetic with.
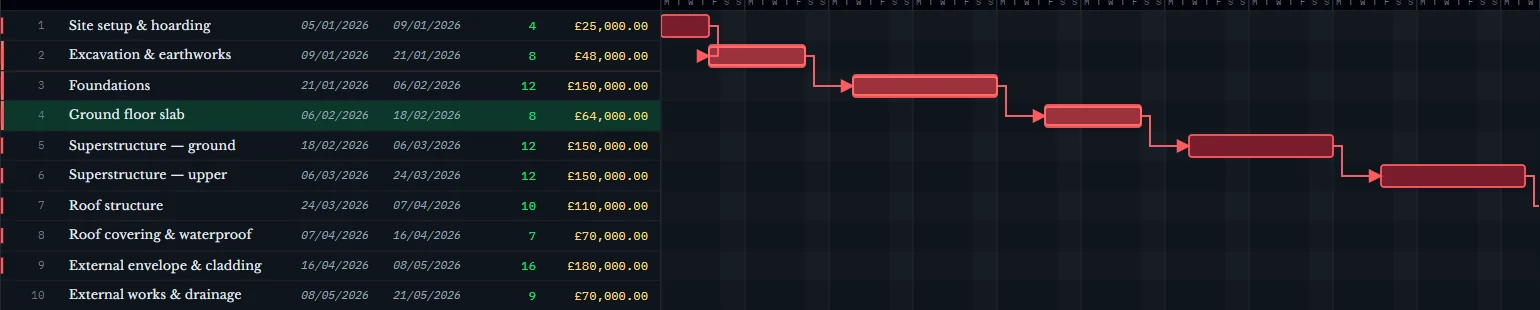

There is one rule in there that took me a while to get right. A risk is one event. If it touches three activities, its delay lands once, on the critical-most activity it touches — not three times, once per task. Get that wrong and a register with twenty risks produces a forecast nobody believes, because the delays stack up into a number that is obviously silly.
Planned isn't done
This is the part I would defend hardest, because it is where most risk processes quietly cheat.
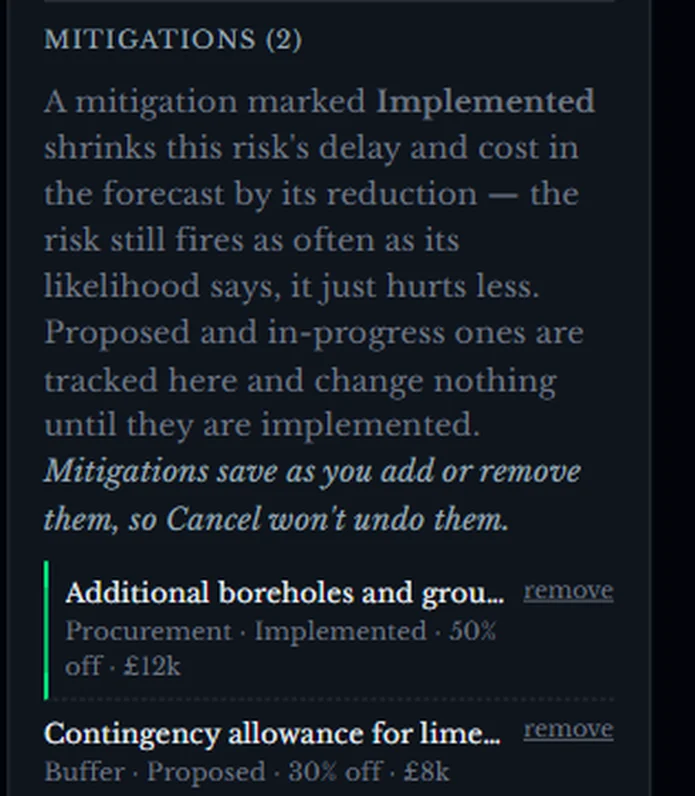
Only a mitigation marked implemented shrinks the risk in the forecast. Proposed and in-progress ones are tracked and costed and change nothing at all. You cannot bank work you have not done, which is exactly the behaviour a register needs if anyone is going to trust the number at the bottom of it.
And when it does bite, it bites softly rather than less often. A risk with an implemented mitigation still fires as often as its likelihood says — it just hurts less. That is how mitigation works on site, and it is worth the tool being honest about the difference.
The matrix is still there
I thought about dropping the five-by-five grid. I kept it, because it is what actually gets put on a wall and presented to a client, and a tool that refuses to produce the thing people need just makes them go back to the spreadsheet.
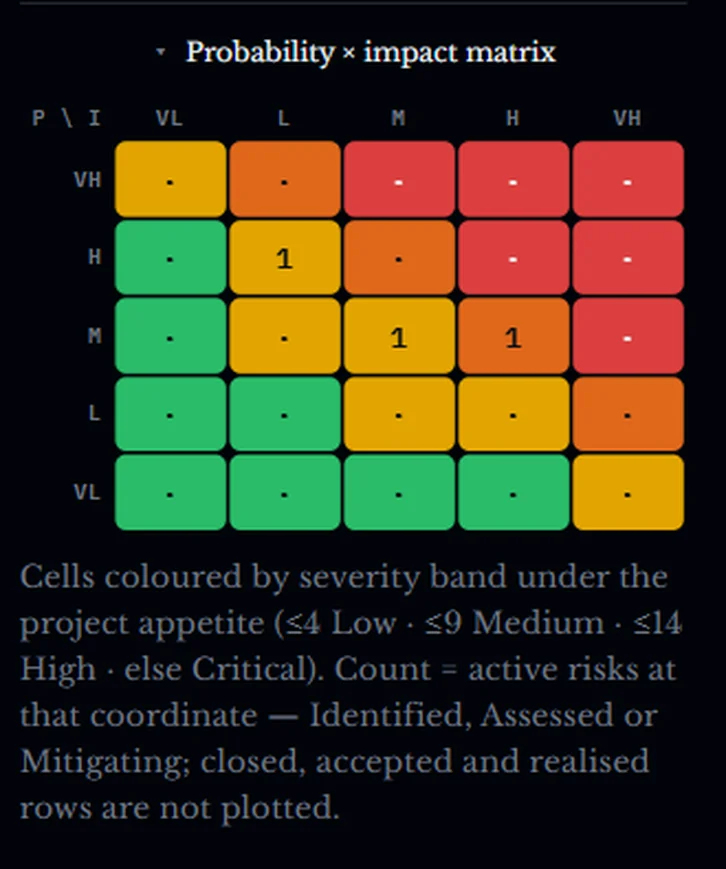
With one condition: the counts are active risks only. Closed, accepted and realised rows are not plotted. So the picture on the wall matches the odds in the model, instead of slowly drifting away from it as the job goes on and nobody tidies the sheet.
The register feeds the forecast
Here is where a priced register stops being paperwork. Every logged risk goes into the same two thousand simulated runs as the programme, firing as often as its band says, and the forecast comes back twice — with risks and without.

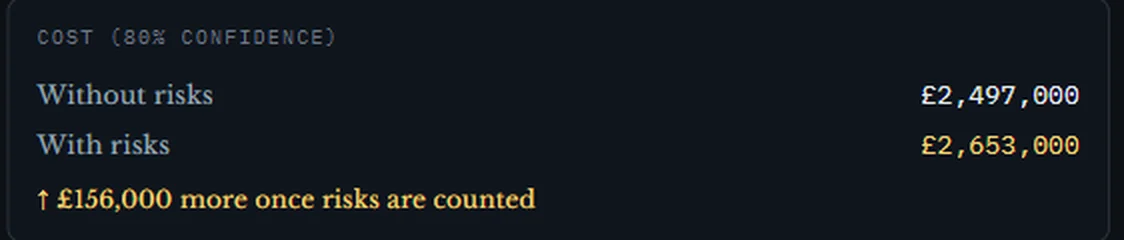
Because both numbers come out of one simulation, the register and the forecast can never tell different stories. On most jobs those two live in separate documents owned by separate people, and the gap between them is where a month of argument comes from.
The number that surprised me
The risks in that register are worth £63,100 after the mitigations already implemented. That is what a spreadsheet would tell you, and it is a perfectly reasonable figure to carry.
But what those same risks do to the final account is £156,000 — nearly two and a half times as much. The difference is not an error. It is the money that time drags along with it: fourteen more days of standing hire, prelims, site staff and overhead, none of which appears anywhere in the register itself.
The register prices the risk. The forecast prices what the risk does to the job. A spreadsheet can give you the first number. It cannot give you the second, and the second is the one that turns up in the final account.
Something a QS will actually read
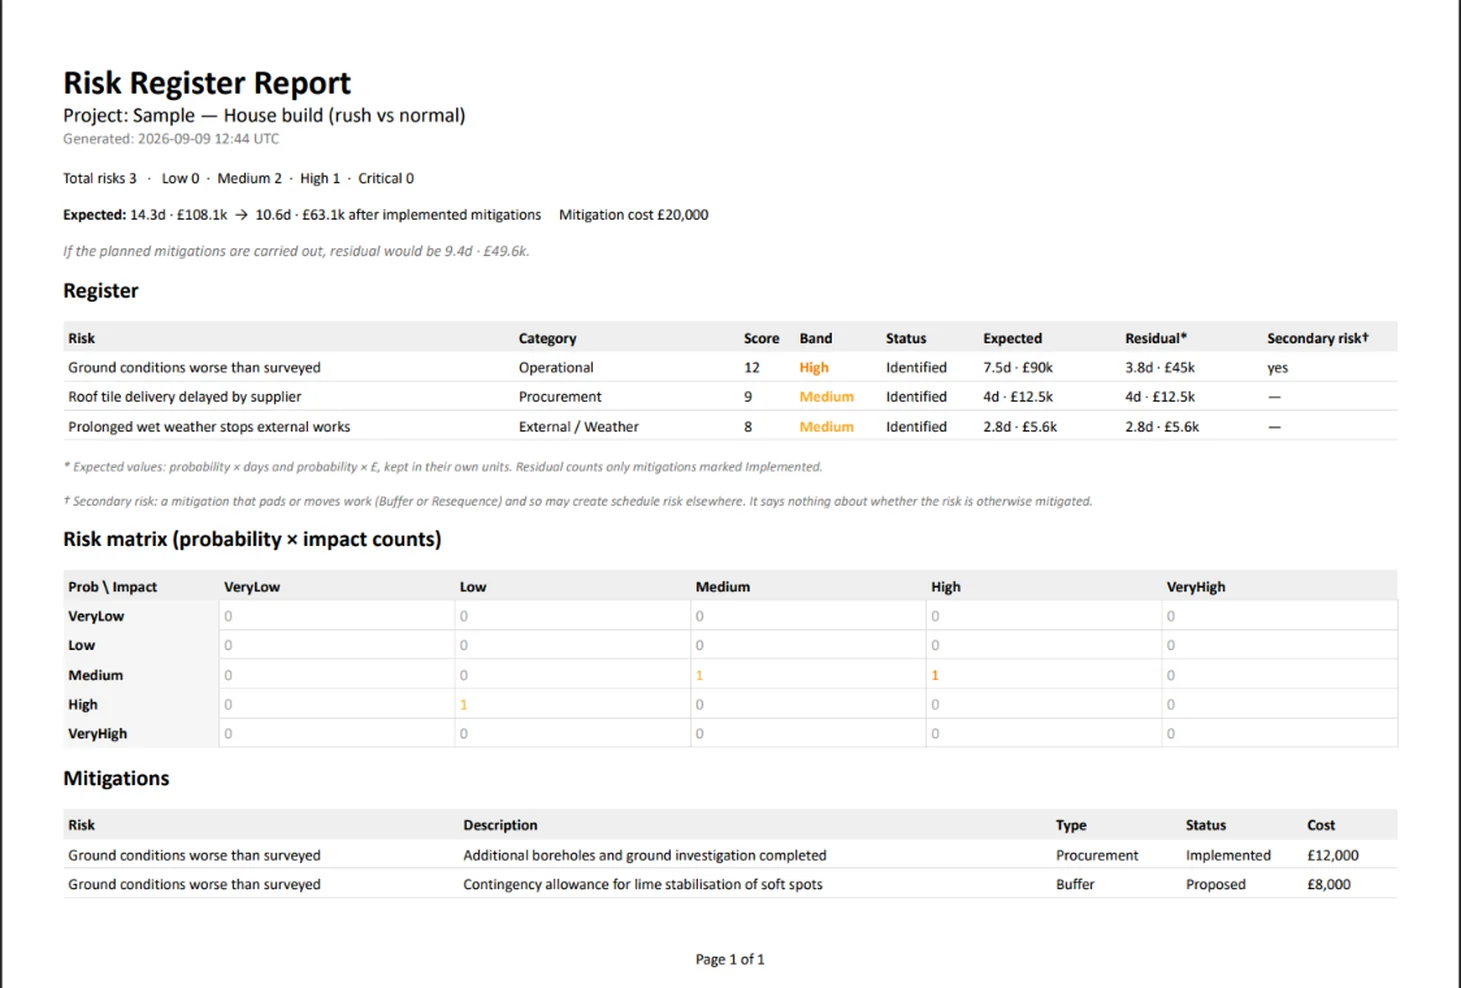
CSV and PDF, straight out of the register. The footnotes matter as much as the table: residual counts only mitigations marked implemented, and a mitigation that pads or moves work is flagged as possibly creating schedule risk somewhere else. A report that hides its own assumptions gets picked apart the first time it is inconvenient.
Run it on your own register
GeneraGantt reads MS Project, Primavera P6 and Asta Powerproject, and the risk and forecast reports download as CSV and PDF, each stating the day they were measured at. Nothing is saved: your schedule leaves with you.
It is free while it is in testing, with a sample programme and register loaded, so you can price a risk and watch the finish date move without uploading anything of your own.
Figures in this article come from the sample programmes in GeneraGantt.